Journal of APPLIED BIOMEDICINE
ISSN 1214-0287 (on-line)
ISSN 1214-021X (printed)
Volume 11 (2013) No 1, p 33-40
DOI 10.2478/v10136-012-0018-7
Effects of insulin therapy on fracture healing and expression of VEGF in diabetic rats
Da-Wei Wang, Shun-Lei Du, Ming-Tao Xu, Yi-Ting Lu, Zhan-Chao Wang, Le-Xin Wang
Address: Le-Xin Wang, School of Biomedical Sciences, Charles Sturt University, Wagga Wagga, NSW 2678, Australia
lwang@csu.edu.au
Received 21st April 2012.
Revised 12th June 2012.
Published online 12th June 2012.
Full text article (pdf)
Summary
Key words
Introduction
Materials and Methods
Results
Discussion
Acknowledgement
References
SUMMARY
This study was designed to investigate effects of insulin on fracture healing and expression of vascular endothelial growth factor (VEGF) in diabetic
rats. Wister rats were randomly divided into diabetic control (n=66), diabetic insulin (=66) and non-diabetic control group (n=66). Diabetes was
established by peritoneal injection of alloxan. Tibia fracture was surgically created and was allowed to heal. Radiological and biomechanical
examinations were performed on the healing tibia. Immuohistochemistry was used to assess VEGF expression in the healing fracture tissues. Cortical
reconstruction of the fracture sites in non-diabetic control and diabetic insulin groups was more rapid than in diabetic control group within 6 weeks
of the fracture. Mechanical strength of the affected tibia in the diabetic insulin and non-diabetic control group was superior to diabetic control
group. Histological examination of the fracture sites revealed a delay in chondrocyte maturation and hypertrophy in diabetic control group. VEGF
expression was widely distributed in fracture sites within the first 4 weeks in control and diabetic insulin treatment group. However VEGF expression
in the callus and periosteum in diabetic control group was much less than in diabetic insulin or non-diabetic control group. In conclusion, diabetes
delays fracture healing and adversely affects callus formation with a reduced VEGF expression at the fracture sites. Insulin therapy improves fracture
healing in diabetes rats, possibly through enhancing VEGF expression in the fractured bones.
KEY WORDS
insulin; fracture; VEGF; diabetes; rats
INTRODUCTION
Diabetes is a common chronic disease that is
associated with significant morbidity and mortality.
Patients with diabetes who sustain a fracture are at
increased risk for complications including higher
rates of in hospital mortality, in-hospital postoperative
complications, delayed bone healing and nonunion
(Gaston and Simpson 2007, Wukich et al. 2011). In
diabetic animals, the recovery of structural and
material strength in healed fractures is delayed by at
least 1 week compared with that in controls (Funk et
al. 2000). Even few weeks after healing, fracture
callus from the diabetic animals had a 29% decrease
in tensile strength and a 50% decrease in stiffness
compared with the controls (Macey et al. 1989). The
mechanisms of delayed fracture healing in diabetic
patients or animal models are unclear. Experimental
studies suggested that impaired osteoclast function
may contribute to decreased cartilage resorption and
delayed endochondral ossification in diabetes
(Kasahara et al. 2010). Diabetes was also found to
cause an upregulation of proapoptotic genes during
the transition from cartilage to bone in fracture
healing, increasing chondrocyte apoptosis (Kayal et
al. 2010). In addition, inadequate expression of genes
that regulate osteoblast differentiation (Lu et al.
2003), suppression of cellular proliferation of chondroprogenitor cells and inhibition of chondrocytes in
soft calluses during early stages of healing (Ogasawara et al. 2008), may also be responsible for the
delayed fracture healing in diabetic animals.
Insulin seems to alleviate the delays in facture
healing in diabetic animals. In diabetic animals
treated with insulin, the tensile strength and stiffness
of the callus at 2 weeks was restored to the same level
as the controls (Macey et al. 1989). Direct delivery of
insulin to the fracture site in diabetic rats returned
fracture healing to normal (Gandhi et al. 2005). When
diabetic mice was treated with slow release insulin to
maintain normal serum glucose levels, the loss of
cartilage and enhanced osteoclastogenesis seen in the
control group was normalized by treatment with
insulin (Kayal et al. 2009). Higher level of
chondrocyte apoptosis in diabetic mice was also
blocked by insulin (Kayal et al. 2009). The
mechanisms by which insulin alleviates loss of
cartilage and facilitates endochondral bone formation
during fracture repair in diabetic animals are unclear.
As vascular endothelial growth factor (VEGF) played
a role in the healing of fractures in animal models
(Huh et al. 2009, Kidd et al. 2010) or in humans
(Sarahrudi et al. 2009), we hypothesized that VEGF
may be involved in the insulin-stimulated fracture
healing in diabetic rats.
MATERIALS AND METHODS
Animal model
This study was approved by the institutional review
board of Taishan Medical University, and principles
of laboratory animal care (NIH publication No. 85-23,
revised 1985) were followed. Male Wister rats
(n=198, weight 280-320 g) were randomly divided
into diabetic control (n=66), diabetic insulin (n=66)
and non-diabetic control group (n=66). Diabetes was
induced in diabetic control and diabetic insulin group
by intraperitoneal injection of 5% solution alloxan
(200 mg/kg body weight, Sigma, USA). Venous
blood glucose was tested 48 hours after the injection.
Animals whose blood glucose was greater than
16.7 mmol/l were chosen as diabetic animals (Islam
and Loots 2009, Lee et al. 2010). In the diabetic
insulin group, insulin was administered subcutaneously (Novolin 30R, Novo Nordisk, Denmark) at
a daily dose of 8-10U/kg/d for 8 weeks. Fasting
blood glucose was measured daily and the dose of
insulin was adjusted to maintain the blood glucose
between 4 to 9 mmol/l. In the non-diabetic control
group, no alloxan was administered, but normal saline
was subcutaneously injected daily throughout the
experiment. Under in sterile conditions and general
anesthesia with sodium pentobarbital, a closed tibia
fracture of the right hinder leg was surgically created
in all animals.
Radiological and biomechanical examination
At 1, 2, 4, 6, 8 weeks following tibia fracture, 14 rats
from each group were euthanized and the right hinder
leg was imaged by X-ray. X-ray films were examined
by a radiologist to assess healing of the fracture sites
and the growth of callus. A self-designed scoring
system was used by the radiologist to semiquantitatively assess the fracture healing and callus
growth, in order to maintain consistencies between
animals. In the second cohort of 14 rats from each
group, the fractured tibias at week 4, 6 and 8 of the
experiment were retrieved and soft tissues removed.
In each group, 7 rats were used for bending strength
test for the tibia, and the other 7 were used for
torsional strength testing.
Histology and immunohistochemistry
At day 3, week 1, 2, 4, 6 and 8 following a tibia
fracture, 4 animals from each group were randomly
selected and euthanized. The fracture site of the tibia
was sliced into 0.5 cm long specimens. After washing
with normal saline, the specimens were placed in 10%
neutral formalin and fixed for 24 hours. After
embedding in paraffin, 20% EDTA was added to the
specimens for decalcification. Bone tissues from the
fracture sites were cut into 5m thick sections, which
were stained by hematoxylin and eosin stain. VEGF
in the bone tissue was measured with ready-to-use
SABC immunohistochemistry kit (Boster Biological
Engineering, Wuhan, China). Tissues were stained
with rat anti-VEGF antibody. Sections of samples
were deparaffinized in xylene, hydrated through a
graded series of ethanol, and then immersed in 3%
hydrogen peroxide in 100% methanol for 30 min. The
sections were boiled in 10 mM citrate buffer, pH 6.0
for 30 min. After being rinsed in phosphate-buffered
saline (PBS), the sections were incubated with normal
rat serum for 10 min. They were subsequently
incubated overnight at 4 °C in humid chambers with
rat anti-VEGF antibody. After washing with PBS, the
slides were treated with peroxidase-conjugated
streptavidin for 20 min, followed by treatment with
0.01% H2O2 and 0.05% diaminobenzidine tetrahydrochloride for 3 min.
Positive VEGF expression rate was measured as
following: under light microscope (x40), cells with
positive VEGF expression and total number of cells
were counted in each visual field. VEGF expression
was classified as: no staining (-); weak staining (±);
moderate staining; and strong staining (++).
Statistical analysis
Statistical analysis was performed with SPSS 12.0.
Data were expressed as mean ± standard deviation
(SD). One way ANOVA was used at the significance
level 2alpha=0.05.
RESULTS
Diabetes was established after injection of alloxan in
all animals of the diabetic control and diabetic insulin
group. A tibia fracture was successfully established
and all animals completed the 8 week study.
Radiological and biochemical examination results
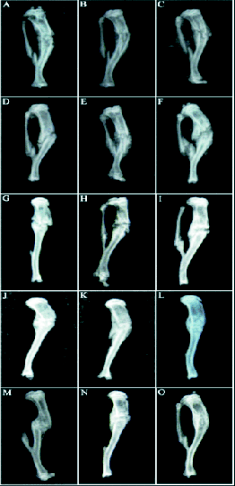
The radiological examination results of the fractures
are shown in Fig. 1. One week after fracture, a
fracture line and a periosteal thickening was present.
The periosteal thickening in diabetic insulin (Fig. 1A)
and non-diabetic control group (Fig. 1C) group was
greater than in diabetic control group (Fig. 1B). Two
weeks after the fracture, trabecular bones were
connecting at the fracture site. The bone formation
and bone membrane in diabetic insulin group (Fig.
1D) and non-diabetic control group (Fig. 1F) was
greater than in diabetic control group (Fig. 1E). Four
weeks after the fracture, there was a clear trabecular
connectivity in diabetic insulin (Fig. 1G) and
non-diabetic control group (Fig. 1I) with a greater
bone mass, but the fracture lines were still clear in
diabetic control group (Fig. 1H) with less bone mass.
Six weeks after the fracture, there was a further
increase in bone mass at the fracture site, the fracture
line was blurred and fully wrapped by callus in
diabetic insulin (Fig. 1J) and non-diabetic control
group (Fig. 1L). The fracture line was still clearly
seen in the diabetic control group (Fig. 1K). At the
end of week 8, bone mass in diabetic insulin (Fig.
1M) and non-diabetic control group (Fig. 1O) was
further increased with little trace of fracture lines. In
diabetic control group (Fig. 1N), fracture was
completely wrapped by the callus, but the fracture
line was still present.
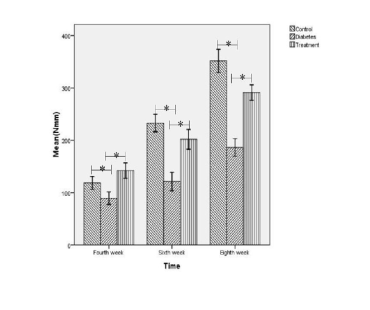
At 4, 6 and 8 week following tibia fracture,
three-point bending strength (Fig. 2) and torsional
stiffness (Fig. 3) in diabetic insulin or non-diabetic
control group was greater than in diabetic control
group (statistically significant).

Fig. 1. Radiological examination of fractured tibia. A, B, C, diabetic insulin, diabetic control and non-diabetic
control group 1 week after fracture; D, E, F, insulin,
diabetic control and non-diabetic control group 2 weeks
after fracture; G, H, I, insulin, diabetic control and
non-diabetic control group 4 weeks after fracture; J, K, L,
insulin, diabetic control and non-diabetic control group 6
weeks after fracture; M, N, O, insulin, diabetic control and
non-diabetic control group 8 weeks after fracture.
Histological examination results
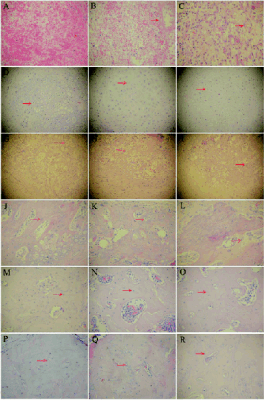
The histological changes during fracture healing are
shown in Fig. 4. Three days after fracture, sections of
callus from diabetic insulin group (Fig. 4A) showed
large amount of red blood cells, but few inflammatory
cells and fibroblasts. A large number of red blood
cells, inflammatory cells and fibroblasts were also
observed in diabetic control group (Fig. 4B), with a
greater number of inflammatory cells in each high
power field than in diabetic insulin group. In
non-diabetic control group (Fig. 4C), granulation
tissues formed at fracture site, showing fibroblasts,
and less number of inflammatory cells than in the
diabetic control group.

Fig. 2. Mean bending rigidity tests of 7 healing tibias in non-diabetic control, diabetic control and diabetic insulin group. * statistically
significant

Fig. 3. Means of torsional strength tests of 7 tibias from control, diabetes and insulin group. Symbols as in Fig. 2.
One week after fracture, the boundaries between
reserve cartilage zone and proliferative zone was
marked in diabetic insulin (Fig. 4D) and non-diabetic
control group (Fig. 4F), with mature chondrocytes
arranged in clusters. In diabetic control group (Fig. 4E), chondrocytes were small, immature and loosely arranged.

Fig. 4. Histological examination results of fracture sites
in the diabetic insulin, diabetic control and non-diabetic
control group. A, B, C, diabetic insulin, diabetic control
and non-diabetic control group 3 days after fracture; D, E,
F, diabetic insulin, diabetic control and non-diabetic control
group 1 weeks after fracture; G, H, I, diabetic insulin,
diabetic control and non-diabetic control group 2 weeks
after fracture; J, K, L, diabetic insulin, diabetic control and
non-diabetic control group 4 weeks after fracture; M, N, O,
diabetic insulin, diabetic control and non-diabetic control
group 6 weeks after fracture; P, Q, R, diabetic insulin,
diabetic and control group 8 weeks after fracture.
Two weeks after the fracture, in diabetic insulin
(Fig. 4G) and non-diabetic control group (Fig. 4I),
mature chondrocytes degraded and osteoblasts
arranged in monolayer on the surface of bone matrix
to form cord-like trabecular bone. Trabecular bones
seen in the diabetic insulin and non-diabetic control
group were sparse in diabetic control group (Fig. 4H).
After 4 weeks, woven bones were formed at the
fracture site, with small and scattered bone marrow
cavity in the diabetic insulin (Fig. 4J) and
non-diabetic control group (Fig. 4L). In diabetic control group (Fig. 4K), callus matrix was mainly
basophilic staining cartilage matrix, and osteoblasts in
bone matrix were bulky, and irregularly arranged.
After 6 weeks, woven bone calluses were combined
to form lamellar bone in the diabetic insulin (Fig. 4M)
and non-diabetic control group (Fig. 4O), marrow
cavity gradually formed a large medullary cavity. In
diabetic control group (Fig. 4N), woven bone calluses
were more mature than before, bone mass were
increased. At the end of week 8, calluses formed
lamellar bone in three groups (Figs 4P, 4Q and 4R),
but in the diabetic control group, osteocytes in bone
matrix were bulky and irregularly arranged.

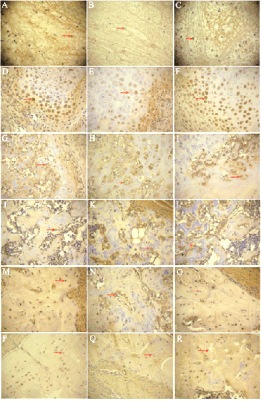
Fig. 5. VEGF expression in healing fractures. A, B, C,
diabetic insulin, diabetic control and non-diabetic control
group 3 days after fracture; D, E, F, diabetic insulin,
diabetic control and non-diabetic control group 1 weeks
after fracture; G, H, I, diabetic insulin, diabetic control and
non-diabetic control group 2 weeks after fracture; J, K, L,
diabetic insulin, diabetic control and non-diabetic control
group 4 weeks after fracture; M, N, O, diabetic insulin,
diabetic control and non-diabetic control group 6 weeks
after fracture; P, Q, R, diabetic insulin, diabetic control and
non-diabetic control group 8 weeks after fracture (DAB ×
200).
Table 1. Immunolocalization of VEGF in healing fractures.
|
|
Weeks of healing | |
|
Week
1 |
Week 2 |
Week 4 | |
|
Cont |
DM |
Ins |
Cont |
DM |
Ins |
Cont |
DM |
Ins | | Intramembranous
ossification
|
Osteogenic cells |
|
|
|
|
|
|
|
± |
± | | Osteoblasts in the
subperiosteal bone |
|
|
|
|
|
|
|
|
| | Endochondral
ossification
|
Fibroblast-like
cells |
|
|
|
|
± |
|
- |
- |
- | | Proliferating
chondrocytes |
|
|
|
|
|
|
- |
- |
- | | Mature
chondrocytes |
|
|
|
|
± |
|
- |
- |
- | | Hypertrophic
chondrocytes |
- |
- |
- |
- |
- |
- |
- |
- |
- | | Osteoblasts in the
trabecular bone
near to
endochondral
ossification front |
|
|
|
|
|
|
|
± |
|
Cont, control; DM, diabetes group; Ins, insulin group; - no staining; ± weak staining; + moderate staining; + + strong staining.
Immunohistochemistry results
The expression of VEGF in the healing fractures is
shown in Table 1. The intensities of expression of
VEGF during fracture healing are shown in Fig. 5.
The brown-yellow staining represents positive
expression of VEGF. There was almost no expression
of VEGF in normal bone tissues.
Three days after fracture, slices of callus showed
that there were mainly hematomas at fracture site in
three groups with visible inflammatory cells. VEGF
staining was positive in extracellular matrix, stronger
staining in diabetic insulin (Fig. 5A) and non-diabetic
control group (Fig. 5C) than in the diabetic control
group (Fig. 5B).
At the end of first week, diabetic insulin and
non-diabetic control group (Figs 5D and F) showed
stronger expression of VEGF than in diabetic control
group (Fig. 5E) in the cytoplasm of subperiosteal
mesenchymal cells, chondroblast and chondrocytes at
the fracture sites. The difference in VEGF expression
between diabetic insulin or non-diabetic control group
and the diabetic control group continued until week 4.
At the end of week 8, there was still positive VEGF
expression in osteocytes in the diabetic insulin group
(Fig. 5P). However, only a small amount of VEGF
expression can be seen in the diabetic control group
(Fig. 5Q), whereas in the non-diabetic control group
there was no trace of VEGF expression in the
cytoplasm of the osteocytes (Fig. 5R).
DISCUSSION
Alloxan is a beta-cell toxic agent, rendering irreversible
damages to islet beta-cells in the pancreas. It has been
used to induce diabetes in animals such as rats (Islam
and Loots 2009, Lee et al. 2010). Dysfunction of
insulin secretion occurs soon after alloxan injection,
with a sustained high level of blood glucose after
24 hours. Alloxan-induced diabetes in rats is similar
to human type 1 diabetes (Lee et al. 2010), but some
investigators believe alloxan-induced diabetes also
share many features of type 2 diabetes (Islam and
Loots 2009). In the present study, a single injection of
alloxan produced diabetes in all animals in which
surgical facture of the tibia was created to study the
impact of diabetes on fracture healing.
Fracture repair involves several distinguishable
processes, such as immediate response to injury,
intramembranous bone formation, chondrogenesis,
endochondral bone, and bone remodelling (Barnes et
al. 1999). These healing processes are largely
regulated by a number of growth factors, such as
fibroblast growth factor, platelet-derived growth
factor, transforming growth factor-beta, or bone
morphogenetic protein (Barnes et al. 1999). In
diabetes, there is a decreased expression of
platelet-derived growth factor, transforming growth
factor-beta and other growth factors such as
insulin-like growth factor (Gaston and Simpson
2007). The reduction of these factors may reduce cell
proliferation in the early phase of fracture healing
(Gaston and Simpson 2007). There was also evidence
that the level of VEGF was reduced in diabetes
(Gaston and Simpson 2007), but the role of this
reduction in the fracture healing process was not
clear.
In the present study, histological examination of
facture sites showed that in untreated diabetic rats,
periosteal reactions were weaker than in control or
insulin treated animals. Maturity of chondrocytes in
the diabetes group was also much delayed than in the
control or insulin group. Biomechanical assessments
revealed that bending strength and torsional stiffness
in the diabetes group were inferior than in control or
insulin group 4 weeks after the fracture. These results
were consistent with previous reports that diabetes
delays fracture healing and decreases biomechanical
performance of the fractured bones (Macey et al.
1989, Funk et al. 2000, Lu et al. 2003, Kasahara et al.
2010, Kayal et al. 2010).
In the present study, VEGF expression was found
in different stages of fracture healing. It was
expressed in the fibroblasts and inflammatory cells in
the hematoma shortly after fracture. One week after
fracture, strong expression of VEGF was seen in the
mesenchymal cells and in chondroblasts. Thereafter,
the expression gradually increased in the osteoblasts,
but began to weaken from week 6. We also found that
VEGF expression in diabetes group was weaker than
in non-diabetic control group within the first 6 weeks
of fracture. Insulin treatment improved VEGF
expression within the first 4 weeks. These results
suggest that insulin treatment following fracture is
associated with an increased VEGF biosynthesis in
the fractured tissues, which may be responsible, at
least in part, for the improved bone healing observed
in this group of animals.
In summary, this study showed that in diabetic
rats, healing of fracture was delayed and
biomechanical strength of the callus was decreased.
The expression of VEGF in the fractured bone tissues
of the diabetes rat was also reduced, indicating that
VEGF reduction may play a role in the compromised
fracture healing processes of the diabetes rats. Insulin
therapy and maintenance of relatively normal blood
glucose restored the level of VEGF expression in the
fractured bones and promoted fracture healing
indiabetic animals. These results indicate that
adequate control of blood glucose, and therapies that
enhance VEGF expression may facilitate fracture
healing in patients with diabetes mellitus.
ACKNOWLEDGEMENT
This study was supported by a research grant from
Scientific Bureau of Shandong Province. Authors
have no conflict of interest to declare.
REFERENCES
Barnes GL, Kostenuik PJ, Gerstenfeld LC, Einhorn TA. Growth factor regulation of fracture repair. J Bone Miner Res. 14: 1805-1815, 1999.
[CrossRef]
[PubMed]
Funk JR, Hale JE, Carmines D, Gooch HL, Hurwitz SR. Biomechanical evaluation of early fracture healing in normal and diabetic rats. J Orthopaedic Res.
18: 126-132, 2000.
[CrossRef]
[PubMed]
Gandhi A, Beam HA, O'Connor JP, Parsons JR, Lin SS. The effects of local insulin delivery on diabetic fracture healing. Bone. 37: 482-490, 2005.
[CrossRef]
[PubMed]
Gaston MS, Simpson AH. Inhibition of fracture healing. J Bone Joint Surg (Br). 89: 1553-1560, 2007.
[CrossRef]
[PubMed]
Huh JE, Kwon NH, Baek YH, Lee JD, Choi DY, Jingushi S, Kim KI, Park DS. Formononetin promotes early fracture healing through stimulating angiogenesis
by up-regulating VEGFR-2/Flk-1 in a rat fracture model. Int Immunopharmacol. 9: 1357-1365, 2009.
[CrossRef]
[PubMed]
Islam MS, Loots du T. Experimental rodent models of type 2 diabetes: a review. Method Finding Exper Clin Pharmacol. 31: 249-261, 2009.
[PubMed]
Kasahara T, Imai S, Kojima H, Katagi M, Kimura H, Chan L, Matsusue Y. Malfunction of bone marrow-derived osteoclasts and the delay of bone fracture
healing in diabetic mice. Bone. 47: 617-625, 2010.
[CrossRef]
[PubMed]
Kayal RA, Alblowi J, McKenzie E, Krothapalli N, Silkman L Gerstenfeld L, Einhorn TA, Graves DT. Diabetes causes the accelerated loss of cartilage
during fracture repair which is reversed by insulin treatment. Bone. 44: 357-363, 2009.
[CrossRef]
[PubMed]
Kayal RA, Siqueira M, Alblowi J, McLean J, Krothapalli N, Faibish D, Einhorn TA, Gerstenfeld LC, Graves DT. TNF-alpha mediates diabetes-enhanced
chondrocyte apoptosis during fracture healing and stimulates chondrocyte apoptosis through FOXO1. J Bone Miner Res. 25: 1604-1615, 2010.
[CrossRef]
[PubMed]
Kidd LJ, Stephens AS, Kuliwaba JS, Fazzalari NL, Wu AC, Forwood MR. Temporal pattern of gene expression and histology of stress fracture healing.
Bone. 46: 369-378, 2010.
[CrossRef]
[PubMed]
Lee JH, Yang SH, Oh JM, Lee MG. Pharmacokinetics of drugs in rats with diabetes mellitus induced by alloxan or streptozocin: comparison with those in
patients with type I diabetes mellitus. J Pharmacy Pharmacol. 62: 1-23, 2010.
[CrossRef]
[PubMed]
Lu H, Kraut D, Gerstenfeld LC, Graves DT. Diabetes interferes with the bone formation by affecting the expression of transcription factors that
regulate osteoblast differentiation. Endocrinology. 144: 346-352, 2003.
[CrossRef]
[PubMed]
Macey LR, Kana SM, Jingushi S, Terek RM, Borretos J, Bolander ME. Defects of early fracture-healing in experimental diabetes. J Bone Joint Surg [Am].
71: 722-733, 1989.
[PubMed]
Ogasawara A, Nakajima A, Nakajima F, Goto K, Yamazaki M. Molecular basis for affected cartilage formation and bone union in fracture healing of the
streptozotocin-induced diabetic rat. Bone. 43: 832-839, 2008.
[CrossRef]
[PubMed]
Sarahrudi K, Thomas A, Braunsteiner T, Wolf H, Vecsei V, Aharinejad S. VEGF serum concentrations in patients with long bone fractures: a comparison
between impaired and normal fracture healing. J Orthopaedic Res. 27: 1293-1297, 2009.
[CrossRef]
[PubMed]
Wukich DK, Joseph A, Ryan M, Ramirez C, Irrgang JJ. Outcomes of ankle fractures in patients with uncomplicated versus complicated diabetes. Foot Ankle
Int. 32: 120-130, 2011.
[CrossRef]
|
BACK
|


