Nacházíte se zde: Úvod > Journal of Applied Biomedicine > 5_3 > martisek.html

martisek.html

Journal of APPLIED BIOMEDICINE
ISSN 1214-0287 (on-line)
ISSN 1214-021X (printed)

Volume 5 (2007)


New methods for space reconstruction of inside cell structures

Dalibor Martisek, Karel Martisek, Jana Prochazkova

Address: Dalibor Martisek, Institute of Mathematics, Faculty of Mechanical Engineering, Brno University of Technology, Czech Republic

martisek@fme.vutbr.cz
Full text article (pdf)
Full text article (html)


Received 24th April 2007.
Revised 25th May 2007.
Published online 27th July 2007.


Summary
This paper discusses new methods for 3-D processing of confocal microscope outputs - single optical cuts through an explored object. The method can model cell illumination by an external light source and is a next important step in the realistic displaying of cells. The computer program based on these methods can be run on a common PC.

Keywords: confocal microscope – vector data – raster data – 3-D model – opacity - illumination


INTRODUCTION

The study of the complicated architecture of cell space structures is an important problem in biology and medical research. Optical cuts of cells produced by confocal microscopes enable 2-D and 3-D reconstructions of observed cells. The existing software tools used to reconstruct small objects usually do not employ all the features of the state-of-the-art hardware. Since the existing software is run on high-level computers, the efficiency of the algorithms is not the issue. Technologies such as OpenGL or DirectX can only be used on graphic stations with special graphic cards with graphics accelerators. These tools have extreme memory fact that these graphics cards are approximately forty times faster than computer processors. The software programmes recommended by the microscope manufacturers usually do not work on standard PCs. For example, the software system used to decode Olympus data halts because of insufficient global memory even on a PC with 2GB RAM. Data visualization based on OpenGL or DirectX does run on a PC, but only with great difficulties.
The main problem is the quality of output created by means of OpenGL and DirectX. With the method proposed, more parameters of the environment can be set, making it possible to apply 3D filters to set the output image sharpness in relation to the noise. The quality of the output is incomparable and is worth increasing the computing time.
We would like offer to the biomedical community mathematical methods of 3D scalar data visualization describing new algorithms that run on standard PCs very well.
Some publications (Druckmüller 2001, 2003, Martišek 2002a, 2002b) were some of the first attempts in this direction.

CURRENT COMMON PRINCIPLES OF 3-D DATA VISUALIZATION

Algorithms which process 3-D data can be classified into two groups: surface fitting algorithms (SF algorithms) and direct volume rendering algorithms (DVR algorithms). SF algorithms construct a geometric surface representation of the scalar field to be displayed, and then construct this surface. DVR algorithms display the scalar field directly without surface representation.
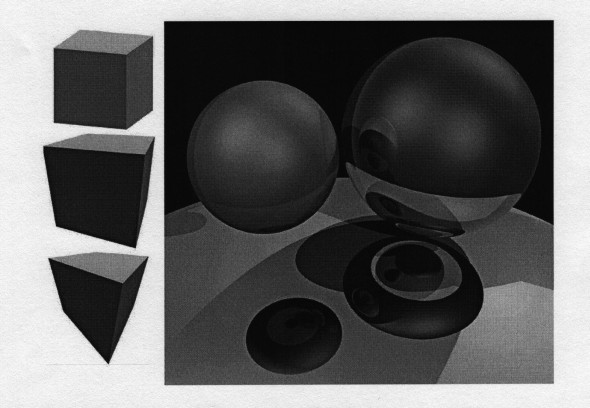
In computer graphics, either vector or raster data can be processed. In terms of graphic data, a vector is understood in the traditional sense being identified with an intuitively understood oriented line segment, i.e. one with base and end points. Vector data are usually processed by vector algorithms. We can relatively easily use a parallel projection method which simulates a long-distance camera, and centre projection methods to model a camera situated closer to the object. Determining for this projection is an angle called a viewing angle – see Fig. 1 on the left.

fig1martisek5_2.jpg

Fig 1. 3-D processing of vector data. Parallel and central projection of a cube on the left - the cube was projected by a viewing angle of 0o (parallel projection), 42o (maximum of human viewing angle) and 70 o (wide-angle objective). Light and shadow of a scene on the right – the sphere on the left reflects virtually no light at all, and the lower sphere reflects almost all the light. Both of the coefficients (mirror component and diffuse component) are 50% for the sphere on the right. The ambient component is 30%. The scene is illuminated by three light sources.

While displaying vector data, we usually work with illumination as well. Light illuminates a scene (the space displayed) in a certain direction. If a planar optical interface had a microscopically ideal surface then both reflection and refraction would preserve parallelism. However, a real body does not have a totally smooth surface so both reflected and refracted beams have various directions. Asperities have a fractal character and the properties of reflected and refracted beams can be described only approximately. A function which tries to describe this character is called a reflection (refraction) function. An application of this function in a particular situation is then called an illuminant model. Object lighting is important for space information processing realised by human vision. The interpretation of light reflection and refraction can be approached in two ways in the case of vector data. Physical models result from the physical laws of light propagation trying to describe the reflection from an uneven surface through the use of the energy propagation principle. These methods are very difficult, very time-consuming and are only applicable to real calculations with serious difficulties. Empirical models do not have a direct relation to the physical principles of light propagation and trying to simulate the expected result in a simple way. They are far simpler, and applications based on them are considerably faster. The simplest empiric illuminant models result from the fact that the whole luminous intensity coming from a given point to an observer is given by the sum of the specular and the diffusive components. “A uniform contribution of ambient light“ is mostly also added . This component inhibits areas reversed from light sources to be displayed as completely black ones. Hence, the total luminous intensity is given by the sum of these components. The simplest empiric illuminant model is called Phong’s model. We can see an implementation of this model in Fig. 1 on the right.

fig2martisek5_2.jpg

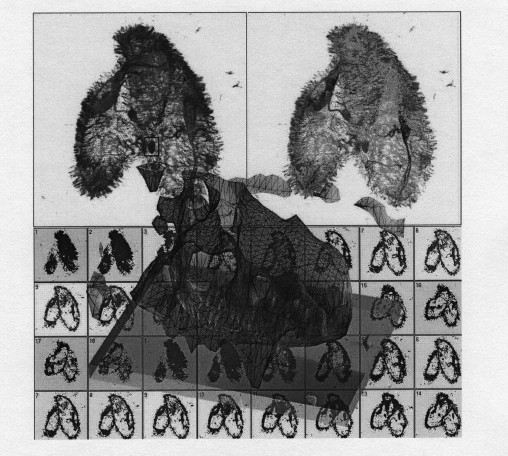
Fig 2. 3-D vector processing of raster data. These algorithms are only suitable for visualising high-contrast structures. The central projection with a viewing angle of 25o and an illuminant model with one light source are used. Two infusorian cells Paramecium caudatum with overlapped anterior, detail (micronucleus) were chosen by the rectangle on the 2-D reconstruction.


Raster data do not contain any „vector“ information on saved objects. From these data, it is not possible to find out in a simple way whether an image is composed of cubes, spheres or something else. A file contains information on the size of the image, on the way it may have been compressed and on the colour encoding used. The image itself is saved as a matrix and each element of this matrix represents one image pixel. Most of the displaying devices (monitors, printers, cameras etc.) work on this principle. The data provided by a confocal microscope are also raster.

NEW SURFACE FITTING METHODS FOR CELL RECONSTRUCTION

Vector visualisation algorithms are, by default, used for vector data, but they can be used for raster data as well (including confocal microscopes data). Raster data mostly contain tens of millions of values. It is usually impracticable to vectorize such amounts of data and therefore these algorithms are only used to visualise selected details of the data structures. Vectorisation works mostly on the principle of detection of an iso-surface, i.e. the surface passing through points of the same density value in a given scalar field. That is why these algorithms are only suitable for visualising high-contrast structures, which can be taken for objects with a strongly defined boundary representing this surface. Central projection and illuminant models can be applied in a relatively simple way. In Fig. 2, we can see the output of our software - two infusorian cells Paramecium caudatum with overlapped anteriors. In the background, there are 2-D reconstructions with different transparencies and reduced optical cuts. In front is a 3-D reconstruction of the micronucleus provided by the iso-area detection method. Pseudo-colours are used – called a topographical palette (the blue parts are lower than the brown ones). Another possible colour wheel is used for 2-D reconstruction on the right. The primary data have a grey-scale palette.
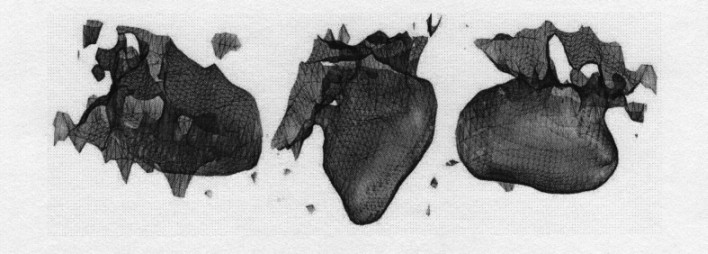
The isolated micronucleus from Fig. 2 can be seen in Fig. 3 with various viewing angles used.

fig3martisek5_2.jpg

Fig.3. The isolated micronucleus from Fig.2 displayed at various viewing angles.

NEW RASTER METHODS FOR CELL RECONSTRUCTION

The basic principle of current DVR algorithms is called ray casting. The method tracks the viewing ray and calculates the values of the scalar field. The standard methods that work with 3-D raster data use 2-D methods for ray casting: a maximum intensity projection algorithm (MIP algorithm) displays the most intensive pixel. The Summed Intensity Projection algorithm (SIP algorithm) displays the sum of pixel intensity, the average intensity projection algorithm (AIP algorithm) displays the arithmetic mean of pixel intensity. (Levoy 1988). Other more precise methods have also been developed. These raster methods, however, consume an enormous volume of computer memory and require high-speed processing (DruckmĂĽller 2001, 2003). Moreover, these methods can only be used for work with parallel projection, and not with centre projection. The cells observed by a conventional or a confocal microscope are often highly transparent, and, because of the lighting geometry, the structures inside the cell do not create visible shadows. The present methods cannot be used to solve this problem because they cannot apply an illuminant model.
Thus question arises: is it possible to find another method by means of which we will be able to abolish at least one of these insufficiencies? The response to this question appears to be positive. Moreover, it is possible to solve both these problems (fasting and shading) at once. The tool we are after is Bresenham's raster algorithm of 2-D line segment construction in integer arithmetic generalized for 3-D. This generalized algorithm can be called line segment voxelization. With the use of this generalization, the basic calculation time of one image drops from several minutes to approximately twenty seconds.
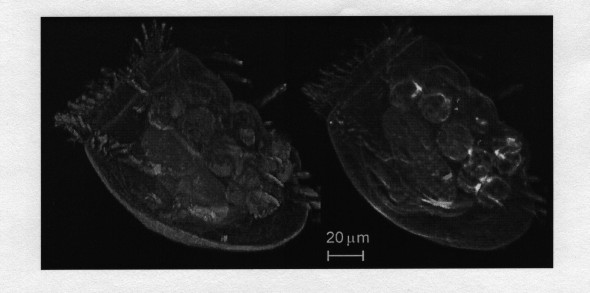
An illuminant model can be applied to raster data as well. After some modification, it is even possible to use models originally developed for Computer Aided Design (CAD) systems. These systems are usually used in mechanical engineering. Modified formulas of Phong’s model were applied to each voxel of three-dimensional data processed (Fig. 4). Our method makes it possible to use the centre projection not only for vector data, but also for raster data. It is the next important step for cell-realistic representation. Our new method can be characterised by what is called a “free camera“. We can place the camera not only outside the cell but also inside the cell (Fig. 5).
The primary data was obtained by the Olympus Fluoview II fluorescent scan confocal microscope by Prof. R. Janisch (Department of Biology, Faculty of Medicine, Masaryk University, Brno, Czech Republic).

fig4martisek5_2.jpg

Fig 4. Phong’s illuminant model applied to raster data. The cell opacity simulation on the left is taken from Druckmüller (2003). The illuminant model was modified for raster data on the right. The human eye analyses light and shade to obtain space information, therefore, space information is significantly better. Infusorian cell Euplotes patella, in green colour microtubules, red DNA of macronucleus.

fig5martisek5_2.jpg

Fig 5. Cell interior. Methods of central projection and illuminant models are combined with the direct volume rendering method. We obtain a free camera which can be placed inside a cell. Two light sources were used, the transparency of each data element is 90%. Both the mirror and the diffuse components are 50%. The viewing angle is 35o (Interior of Euplotes patella cell).

ACKNOWLEDGEMENT

This study was supported by the Ministry of Education, Youth and Sports of the Czech Republic, research plan MSM 0021630518 "Simulation modelling of mechatronic systems".

REFERENCES

Druckmüller M: Adaptive Image Processing in Biology. In Berger J (ed.): Cells III, Kopp Publ., České Budějovice 2001, pp. 71–79.
Druckmüller M: Opacity simulation technique for confocal microscope image processing. J. Appl. Biomed. 1:71–75, 2003.
Martišek D: The Two-dimensional and three-dimensional processing of images provided by conventional microscopes. Scanning 24:284–295, 2002a.
Martišek D: Three-Dimensional Filters and their Use for Computer Modelling. Proceedings of the 1st International Conference Aplimat, February 7.–8., 2002, Bratislava 2002b, pp. 291–296.

BACK