Journal of APPLIED BIOMEDICINE
ISSN 1214-0287 (on-line)
ISSN 1214-021X (printed)
Volume 8 (2010), No 2, p 93-109
DOI 10.2478/v10136-009-0014-8
Circadian time structure of fatty acids and vascular monitoring
Germaine Cornelissen, Claudio Galli, Franz Halberg, Fabien De Meester, Patrizia Rise, Agnieszka Wilczynska-Kwiatek, Ram B Singh, Francis
Guillaume
Address: Germaine Cornelissen, Halberg Chronobiology Center, University of Minnesota - MMC 8609, 420 Delaware Street SE, Minneapolis, MN 5545, USA
corne001@umn.edu
Received 19th March 2010.
Revised 26th April 2010.
Published online 27th April 2010.
Full text article (pdf)
Abstract in xml format
Summary
Key words
Introduction
Materials and Methods
Results
Discussion
Conclusion
References
SUMMARY
The circadian variation of 40 circulating fatty acids related variables was assessed from one man (F) and one woman (G). Each provided blood
samples by finger pricking at about 4-hour intervals for 24 hours. A statistically significant rhythm was found in 65% of the variables after data
expressed as a percentage of their 24-hour mean values were pooled. In particular, a putative circadian rhythm for n-3 and n-6 fatty
acids deserves exploration. The predominant 12-hour component found to characterize the n-3 status of G may stem from the odd schedule she
followed on the day of study, as attested by alterations in the time structure of her blood pressure on the day of study, as compared to similarly
collected data on 33 other Sundays in 2009 available as control information. Circadian vascular characteristics are sensitive markers of loads,
including the rest-activity schedule.
KEY WORDS
blood pressure; cholesterol; circadian; highly unsaturated fatty acids (HUFA); omega-3 (n-3) and omega-6 (n-6) fatty acids
INTRODUCTION
Focus upon diet and circulating lipids has shifted
from the assumption that a high fat diet raises blood
cholesterol, which in turn is associated with
conditions such as coronary heart disease, to include
the putative role of n-3 (also referred to as omega-3) fatty acids in the modulation of cardiovascular
functions (Dubnov et al. 2008, De Meester 2009,
Simopoulos 2009). In the absence of data on
dynamics, concepts such as "balance" and
"homeostasis" are invoked (De Meester 2009,
Simopoulos 2009), in good company with the aging
Claude Bernard (1885), yet at variance with this
eminent scientist's answer when asked earlier by the
Journal d'Anatomie et de Physiologie what his major
discoveries were. The younger Claude Bernard
singled out "la variabilite immense du milieu
interieur" (Bernard 1865).
Our goal herein is to assess this variability,
remembering Charles Chossat, who demonstrated that
the circadian rhythm in cloacal temperature of
pigeons deprived of all food and water persisted until
the day of death from starvation and dehydration
(Chossat 1843) (Fig. 1). Similarly, the circadian
rhythm in liver glycogen was shown to persist during
starvation (Agren et al. 1931, Haus and Halberg
1966), indicating that feeding alone does not account
for circadian rhythmicity in these variables (Higgins
et al. 1932, 1933). Brillat-Savarin (1826) suggested
that we are what we eat, but we must remember that
we are also "when we eat" (Halberg et al. 1995). In
an experimental model without big fat reserves, the
timing of the availability of food could account for
the difference between death and survival (Nelson et
al. 1973).
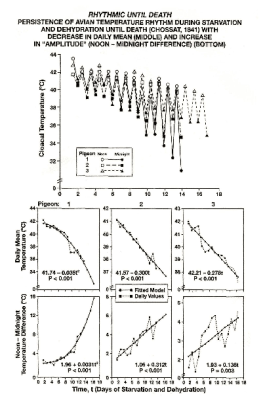
Fig. 1. Demonstration by Charles Chossat (1843) that the
circadian rhythm (gauged by measurements at noon and
midnight) of cloacal temperature of pigeons deprived of all
food and water persists until the day of death from
starvation and dehydration. Top: Records from 3 pigeons.
Bottom: Changes in daily averages (row 1) and
noon-midnight differences (row 2) as a function of time.
Second-order polynomials fitted to these data indicate that
while the average temperature decreases, the prominence of
the circadian variation increases.
Variability, notably along the 24-hour scale has
led to the formulation of circadian systems (Halberg
1959) and the birth of chronobiology (Halberg 1969),
a discipline that eventually led to chronomics
(Halberg et al. 2009) (Fig. 2). We need to lift the
curtain of ignorance drawn over the range of
physiologic variation (Fig. 3), to estimate in statistical
inferential terms the predictable changes that can be
anticipated to recur with time, and to replace concepts
such as "balance" and "homeostasis" with maps of
lawful time structures, the essence of chronobiology
and chronomics, that lead to chronobioethics (Fig. 2).
Computer-implemented hypothesis testing and
parameter estimation thus becomes available to
everyone for risk assessment and detection by
affordable home-based self-surveillance, without the
need to involve a care provider as long as
abnormalities are not found (Sanchez de la Pena
2008, Halberg et al. 2009).
MATERIALS AND METHODS
On 27 Sep 2009, one man and one woman provided
blood samples by finger pricking around the clock at
approximately 4-hour intervals for 24 hours
(6 samples each). Samples were collected at 01:30,
05:30, 10:00, 13:45, 17:45, and 21:30, before meals.
Sleep was between 03:30 and 09:30, with one
interruption at 05:30 for finger pricking and another
around 07:30 for storing the samples after letting
them dry at room temperature for about 2 hours. The
man (F) is 61 years of age and has a history of
insulin-dependent diabetes mellitus first diagnosed at
about 21 years of age. He also takes daily doses of
aspirin (81 mg in the morning) and Lovastatin (20 mg
in the evening), preventively. The woman (G) is
59 years of age and is mostly clinically healthy but
takes synthroid (0.175 mg/day) to treat
hypothyroidism. She also takes calcium and vitamin
D supplementation (Oysco 500/D 3 times a day) and
Alendronate (35 mg/week), preventively. Blood
samples from fingertips were adsorbed on a collecting
kit (Sigma-Aldrich) and analyzed by gas
chromatography for a direct evaluation of fatty acids
(Marangoni et al. 2004, 2007, Rise; et al. 2005,
Yehuda et al. 2005, Lagarde 2008, Stark 2008, Galli
and Calder 2009, Galli et al. 2009, Ratnayake and
Galli 2009). Fig. 4 illustrates the metabolic pathways
of poly-unsaturated fatty acids (PUFA) of the two
series.
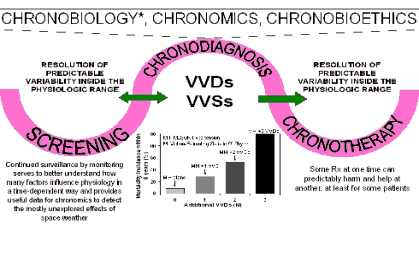
Fig. 2. Scheme illustrating how the study of circadian systems and broader time structures led to the development of
chronobiology, chronomics, and eventually to chronobioethics. From a practical viewpoint, screening and continued
surveillance is not restricted to single or mean values but to variability assessed in the light of time-varying reference values.
Accordingly, the chronodiagnosis includes alterations in rhythm characteristics and other endpoints serving to guide the
scheduling of any needed treatment (chronotherapy). In the case of blood pressure, screening for vascular variability disorders
(VVDs) is important when outcome studies show that an elevated blood pressure not complicated by other VVDs is associated
with a relatively small increase in cardiovascular disease risk. By contrast, when it is complicated by 1, 2 or 3 additional VVDs,
the risk increases dramatically (box). Modified from De Meester (personal communication).
*Occasionally, human physiological vascular variability (VV) is transiently altered. Lasting alterations become a vascular
variability disorder (VVD), or if VVDs coexist, a VV syndrome (VVS). VVDs and VVSs require detection and chronotherapy
for prehabilitation (thereby reducing the need for rehabilitation; Halberg et al. 2008c, 2009).
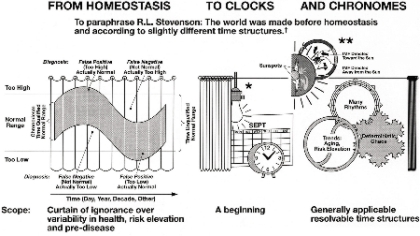
Fig. 3. Abstract graph conveying the need to lift the curtain of ignorance drawn over the physiological range within which
much of the variability occurs in a predictable manner (left). Assessing the circadian and circannual variations (middle) is a
welcome start that is best complemented by a rigorous assessment of much broader time structures that include the investigation
of non-photic as well as photic solar influences on physiology and pathology (right).
*The "Master Switch", **Several switches, including helio-geomagnetics, † Inferential statistical methods map chronomes as
molecular biology maps genomes; biologic chronomes await resolution of their interactions in us and around us, e.g., with
magnetic storms in the interplanetary magnetic field (IMF).
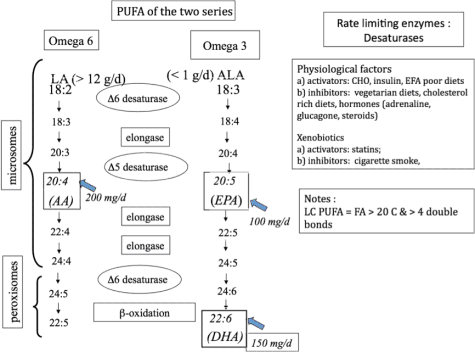
Fig. 4. Illustration of the metabolic pathways of poly-unsaturated fatty acids (PUFA) assessed in around-the-clock samples
from two subjects. From Galli (personal communication).
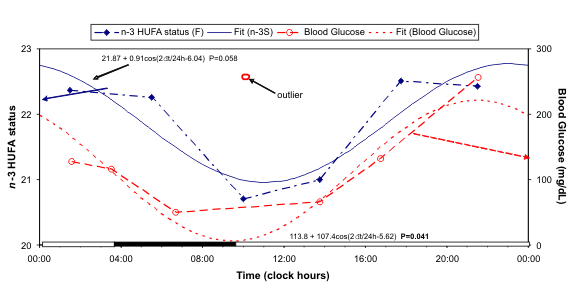
Fig. 5. The circadian variation in n-3 HUFA status of F is similar to that of blood glucose.
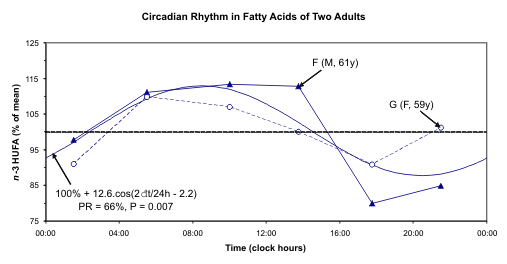
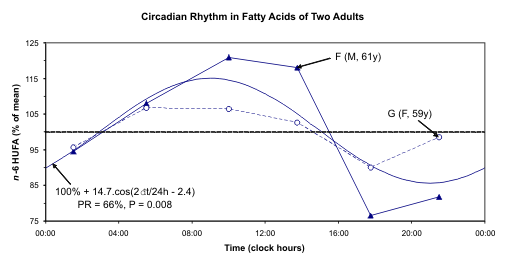
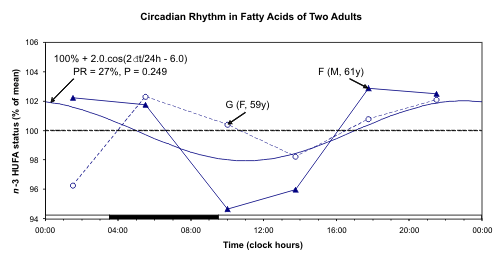
Fig. 6. A circadian rhythm is detected for n-3 HUFA and n-6 HUFA but not for n-3 HUFA status after pooling data
of F and G expressed as a percentage of their respective mean value.
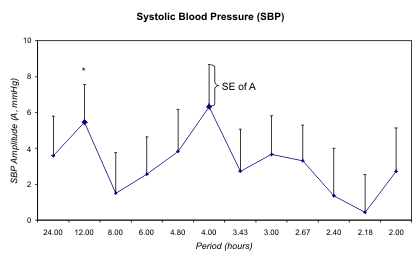


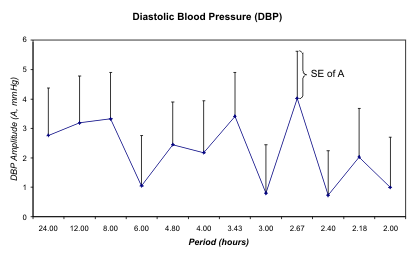

Fig. 7. Least squares spectra of systolic (S) and diastolic (D) blood pressure (BP) and heart rate (HR) of G during the day
of study. A circadian rhythm is only detected for HR. In the case of SBP, the 12-hour but not the 24-hour component is
statistically significant (*).
Table 1. Individual cosinor results of fatty acid related variables - summary at trial period of 24 hours*
|
F (M, 61y) |
G (F, 59y) |
Fatty acid |
P |
PR |
M |
A |
Phi |
Best
fit |
P |
PR |
M |
A |
Phi |
Best
fit | | 16:0
18:0
20:0
22:0
24:0
16:1
18:1
18:1 n-7
20:1
22:1
24:1
20:3 n-9
18:2 n-6
18:3 n-6
20:3 n-6
20:4 n-6
22:4 n-6
22:5 n-6
18:3 n-3
20:5 n-3
22:5 n-3
22:6 n-3 |
0.332
0.188
0.045
0.057
0.038
0.630
0.034
0.060
0.267
0.403
0.052
0.477
0.304
0.832
0.107
0.049
0.058
0.088
0.466
0.907
0.078
0.020 |
52
67
87
85
89
27
89
85
59
45
86
39
55
12
77
87
85
80
40
6
82
93 |
27.32
11.29
0.41
1.32
2.23
1.80
20.29
1.54
0.18
0.07
1.99
0.05
20.94
0.16
0.99
5.64
0.97
0.18
0.46
0.29
0.68
1.20 |
0.79
0.36
0.09
0.33
0.58
0.30
3.60
0.28
0.04
0.03
0.54
0.04
1.08
0.02
0.17
1.21
0.26
0.11
0.07
0.01
0.15
0.24 |
-316
-259
-117
-124
-135
-70
-311
-278
-179
-137
-135
-209
-112
-205
-144
-138
-131
-164
-28
-250
-129
-127 |
12
24
24
24
24
12
24
24
24
12
24
12
24
12
24
24
24
24
12
12
24
24 |
0.043
0.366
0.393
0.110
0.071
0.718
0.127
0.610
0.673
0.017
0.095
0.076
0.845
0.279
0.363
0.165
0.292
0.519
0.407
0.857
0.349
0.334 |
88
49
46
77
83
20
75
28
23
93
79
82
11
57
49
70
56
35
45
10
50
52 |
25.96
11.97
0.45
1.69
2.02
1.79
19.27
1.67
0.15
0.07
2.25
0.05
19.59
0.30
0.93
7.36
1.12
0.16
0.38
0.50
0.93
1.40 |
0.64
0.15
0.04
0.30
0.43
0.06
1.31
0.12
0.02
0.03
0.42
0.02
0.21
0.10
0.05
0.48
0.15
0.03
0.11
0.01
0.10
0.12 |
-320
-215
-138
-137
-134
-58
-303
-301
-146
-135
-141
-182
-326
-94
-135
-118
-128
-142
-39
-327
-135
-115 |
24
12
12
24
24
12
24
12
12
24
24
24
12
24
24
24
24
12
12
12
24
24 | | SFA
MUFA
PUFA
U.I. |
0.894
0.070
0.135
0.106 |
7
83
74
78 |
42.58
25.87
31.42
112.1 |
0.19
3.10
3.11
7.90 |
-226
-312
-127
-132 |
12
24
24
24 |
0.788
0.213
0.285
0.158 |
15
64
57
71 |
42.09
25.20
32.41
119.6 |
0.20
0.95
0.74
2.93 |
-168
-297
-108
-112 |
12
24
24
24 | | n-6
n-3
n-6/n-3
DHA/AA
EPA/AA |
0.131
0.118
0.155
0.440
0.077 |
74
76
71
42
82 |
28.88
2.63
11.05
0.21
0.05 |
2.74
0.38
0.63
0.01
0.01 |
-129
-119
-281
-26
-306 |
24
24
24
24
24 |
0.368
0.334
0.572
0.759
0.402 |
49
52
31
17
46 |
29.46
3.20
9.26
0.19
0.07 |
0.60
0.24
0.47
0.003
0.01 |
-109
-97
-274
-141
-322 |
24
24
12
12
12 | | n-3 HUFA
n-6 HUFA
n-3 HUFA
status
EPA/ALA
AA/LA
AA/DHGLA
DHA/ALA
ALA/LA
DHGLA/LA |
0.051
0.053
0.107
0.474
0.052
0.020
0.134
0.466
0.037 |
86
86
77
39
86
93
74
40
89 |
2.17
7.78
21.87
0.63
0.27
5.67
2.68
0.02
0.05 |
0.39
1.74
0.91
0.08
0.05
0.29
0.75
0.003
0.01 |
-129
-139
-346
-215
-141
-120
-154
-25
-144 |
24
24
24
24
24
24
24
24
24 |
0.334
0.145
0.997
0.608
0.236
0.413
0.370
0.343
0.637 |
52
72
0
28
62
45
48
51
26 |
2.83
9.58
22.77
1.48
0.37
7.93
4.10
0.02
0.05 |
0.21
0.69
0.03
0.38
0.03
0.22
1.28
0.01
0.003 |
-121
-122
-211
-192
-118
-69
-180
-26
-146 |
24
24
12
12
24
12
12
24
24 |
Terminology of fatty acids: The first number indicates the number of carbon atoms, the second number after ":" indicates the
number of double bonds.
n-3 or n-6 indicate that the double bond closest to the methyl end (and most distant from the carboxyl end) of the molecule is 3
or 6 carbons away from the methyl end in the carbon chain of the fatty acid.
SFA: saturated fatty acids; MUFA: mono-unsaturated fatty acids; PUFA: Poly-unsaturated fatty acids; U.I.: unsaturation index
[U.I. = (Sum of % of each fatty acid x its number of double bonds)/100)]; DHA: docosahexaenoic acid (22:6n-3); AA: arachidonic
acid (20:4n-6); EPA: eicosapentaenoic acid (20:5n-3); HUFA: highly unsaturated fatty acids; ALA: alpha-linolenic acid
(18:3n-3);
LA: linoleic acid (18:2n-6); DHGLA: dihomo-gamma-linolenic acid (20:3n-6).
* P: P-value from zero-amplitude test; PR: percentage rhythm, proportion of variance accounted for by least squares fit of 24-hour
cosine curve; M: MESOR, rhythm-adjusted mean; A: 24-hour amplitude, half the extent of predictable variation within a day;
phi: 24-hour acrophase, a measure of the timing of overall high values recurring each day; Best fit: period of 24-hour or 12-hour
component accounting for the largest proportion of overall variance.
Results for UI, DHA/AA, EPA/AA, EPA/ALA, AA/LA, AA/DHGLA, ALA/LA, and DHGLA/LA, referring to selected ratios
between PUFA relevant as indices of metabolic steps (product/precursor ratios) or as ratios between relevant PUFA of the n-3
and n-6 series (e.g., EPA, DHA and AA), are included for completeness, even though they are not directly pertinent to the major
topic of this paper.
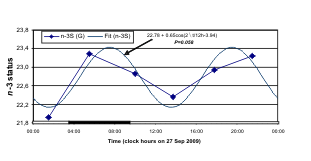
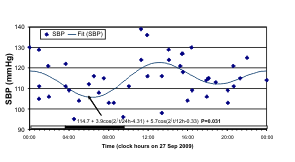

Smaller circadian amplitude (A) of blood pressure
(BP) and heart rate (HR) on study day (27 sep 2009)
with 12-hour prominence (right), a gauge of dynamics
of fatty acid n-6/n-3 ratio (left, top) - G (F, 59y)
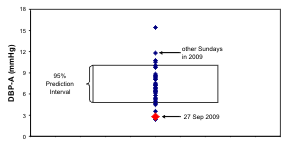
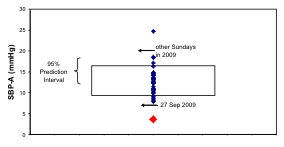
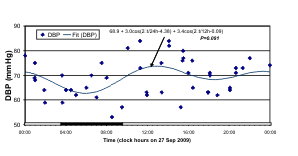
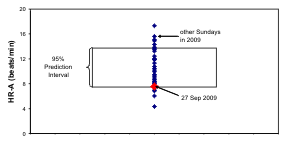
Fig. 8. The odd schedule of G on the day of study may account for the 12-hour prominence in her records of n-3 HUFA
status and systolic (S) blood pressure (BP). By comparison to the distribution of 24-hour amplitudes of SBP, diastolic (D) BP
and heart rate (HR) on all other Sundays in 2009, those on the day of study were lowest for BP and among the lowest for HR,
lying below the lower 95% prediction limit of BP amplitudes.
Table 2. Cosinor results of fatty acid related variables of pooled data expressed as a percentage of their respective 24-hour
mean values - summary at trial period of 24 hours*
| Fatty acid |
P |
PR |
A |
Phi |
Best fit | | 16:0
18:0
20:0
22:0
24:0
16:1
18:1
18:1 n-7
20:1
22:1
24:1
20:3 n-9
18:2 n-6
18:3 n-6
20:3 n-6
20:4 n-6
22:4 n-6
22:5 n-6
18:3 n-3
20:5 n-3
22:5 n-3
22:6 n-3 |
0.013
0.054
0.010
<0.001
<0.001
0.411
0.003
0.027
0.151
0.012
<0.001
0.215
0.469
0.475
0.022
0.010
0.005
0.031
0.105
0.803
0.008
0.004 |
62
48
64
79
85
18
72
55
34
63
81
29
15
15
57
64
69
54
39
5
66
70 |
2.66
2.10
14.14
21.48
23.81
10.00
12.19
12.50
17.21
43.52
22.98
51.89
2.15
15.86
11.01
13.87
19.95
39.12
21.57
2.30
16.75
14.23 |
-318
-247
-124
-129
-135
-68
-309
-285
-167
-137
-137
-198
-103
-114
-142
-133
-130
-159
-34
-300
-131
-124 |
24
24
24
24
24
12
24
24
24
24
24
24
12
12
24
24
24
24
24
24
24
24 | | SFA
MUFA
PUFA
U.I. |
0.703
0.012
0.039
0.015 |
8
63
51
61 |
0.40
7.82
6.05
4.70 |
-196
-308
-123
-127 |
12
24
24
24 | | n-6
n-3
n-6/n-3
DHA/AA
EPA/AA |
0.044
0.015
0.068
0.501
0.008 |
50
61
45
14
65 |
5.73
10.79
5.34
1.99
16.22 |
-125
-111
-278
-48
-308 |
24
24
24
12
24 | | n-3 HUFA
n-6 HUFA
n-3 HUFA status
EPA/ALA
AA/LA
AA/DHGLA
DHA/ALA
ALA/LA
DHGLA/LA |
0.007
0.008
0.249
0.250
0.004
0.023
0.030
0.132
0.016 |
66
66
27
27
71
57
54
36
60 |
12.59
14.70
2.04
19.17
12.20
3.57
28.89
20.61
9.43 |
-127
-135
-345
-200
-137
-102
-168
-30
-148 |
24
24
12
12
24
24
24
12
24 |
For terminology of fatty acids, see Table 1.
* P: P-value from zero-amplitude test; PR: percentage rhythm, proportion of variance accounted for by least squares fit of 24-hour
cosine curve; M: MESOR, rhythm-adjusted mean; A: 24-hour amplitude, half the extent of predictable variation within a day;
phi: 24-hour acrophase, a measure of the timing of overall high values recurring each day; Best fit: period of 24-hour or 12-hour
component accounting for the largest proportion of overall variance.
Results for UI, DHA/AA, EPA/AA, EPA/ALA, AA/LA, AA/DHGLA, ALA/LA, and DHGLA/LA, referring to selected ratios
between PUFA relevant as indices of metabolic steps (product/precursor ratios) or as ratios between relevant PUFA of the n-3
and n-6 series (e.g., EPA, DHA and AA), are included for completeness, even though they are not directly pertinent to the major
topic of this paper.
40 variables (80%). On the average, the circadian variation accounts for a predictable excursion of 14.3% around the 24-hour
mean value (standard deviation: 11.4%), and up to 51.9%.
Table 3. Average fatty acid (FA) composition (% of total FA) in whole blood drops in a reference Italian population.
| Fatty acid |
Men (N = 322) |
Women (N = 328) |
| |
Mean |
SE |
Mean |
SE |
| | 16:0
18:0
20:0
22:0
24:0
16:1
18:1
18:1 n-7
20:1
22:1
24:1
20:3 n-9
18:2 n-6 |
22.93
11.74
0.42
1.28
2.56
1.22
21.61
1.74
0.20
0.50
3.18
0.20
16.78 |
0.12
0.09
0.00
0.02
0.04
0.03
0.17
0.02
0.00
0.02
0.05
0.02
0.17 |
22.52
11.66
0.45
1.33
2.42
1.21
20.77
1.71
0.19
0.52
3.13
0.19
18.50 |
0.11
0.06
0.00
0.01
0.03
0.03
0.15
0.02
0.00
0.02
0.04
0.01
0.16 |
**
** | | 20:3 n-6
20:4 n-6
22:4 n-6
22:5 n-6
18:3 n-3
20:5 n-3
22:5 n-3
22:6 n-3 |
1.45
8.53
1.24
0.24
0.29
0.44
0.92
1.95 |
0.02
0.08
0.03
0.01
0.01
0.02
0.02
0.04 |
1.50
8.44
1.13
0.22
0.31
0.46
0.91
1.88 |
0.02
0.07
0.02
0.01
0.01
0.02
0.02
0.04 |
* | | SFA
MUFA
PUFA |
39.26
27.99
32.75 |
0.14
0.18
0.19 |
39.24
27.79
32.96 |
0.16
0.18
0.20 |
| | n-6
n-3
n-6/n-3
n-3 HUFA
n-6 HUFA
n-3 HUFA status |
28.98
3.58
8.09
11.46
3.31
22.34 |
0.18
0.06
0.00
0.11
0.06
0.34 |
29.21
3.56
8.20
11.30
3.26
22.15 |
0.20
0.06
0.00
0.09
0.06
0.31 |
|
For terminology of fatty acids, see Table 1.
*P 0.01; ** P 0.001 from reference Italian population (Galli et al. 2009).
Results for UI, DHA/AA, EPA/AA, EPA/ALA, AA/LA, AA/DHGLA, ALA/LA, and DHGLA/LA, referring to selected ratios
between PUFA relevant as indices of metabolic steps (product/precursor ratios) or as ratios between relevant PUFA of the n-3
and n-6 series (e.g., EPA, DHA and AA), are included for completeness, even though they are not directly pertinent to the major
topic of this paper.
Blood glucose was also determined around the
clock by F with a OneTouch UltraLink (Medtronic)
glucometer. Systolic (S) and diastolic (D) blood pressure (BP) and heart rate (HR) were automatically
measured around the clock at about 30-min intervals
by G with an ambulatory monitor (TM-2430) from
A and D (Tokyo, Japan).
Each data series was analyzed by the extended
cosinor (Halberg 1980, Cornelissen and Halberg
2005, Refinetti et al. 2007). A 24-hour (or 12-hour)
cosine curve was fitted by least squares to each
variable, yielding estimates of the MESOR (Midline
Estimating Statistic Of Rhythm, M; usually more
precise and more accurate than the arithmetic mean),
the double circadian amplitude (2A, an estimate of the
predictable extent of change within a cycle), and the
circadian acrophase (phi, an estimate of the timing of
overall high values recurring in each cycle).
In view of the relatively small number of
determinations for each individual time series, the
data from F and G were pooled after being expressed
as a percentage of their respective mean value.
Cosinor analyses were repeated on these pooled
relative data with trial periods of 24 and 12 hours.
Testing was at the significance level 2alpha = 0.05. The
n-3 and n-6 HUFA (Highly Unsaturated Fatty Acids)
and their (n-6/n-3) ratio (n-3 status) were also fitted
with a composite model consisting of cosine curves
with periods of 24 and 12 hours.
RESULTS
The circadian rhythm characteristics of all 40 fatty
acid related variables assessed by gas
chromatography are listed for both F and G in
Table 1. A circadian rhythm could be demonstrated
with statistical significance for 7 variables for F and
for 2 variables for G. In only 8 of 40 variables was
the 12-hour component more prominent than the
24-hour one for F, whereas for G, the 24-hour
component was the most prominent one in only 23 of
the 40 variables, Table 1.
As seen from Fig. 5, in the case of F, the circadian
variation in the n-3 HUFA status is similar to that of
blood glucose, also measured by finger prick, after
removal of an outlier resulting from an
over-compensation of a hypoglycemic episode. The
circadian variation in blood glucose is detected with
statistical significance.
After expressing the data as a percentage of their
respective mean values and pooling the data from F
and G for each variable, a circadian rhythm is
detected in 26 cases (65%, Table 2). Statistical
significance is thus reached in many more cases than
the 5% expected by chance alone. Moreover, the
24-hour component predominates in 32 of the
40 variables (80%). On the average, the circadian
variation accounts for a predictable excursion of
14.3% around the 24-hour mean value (standard
deviation: 11.4%), and up to 51.9%.
The individual data and the 24-hour cosine curve
fitted to the pooled relative values of n-3 HUFA, n-6
HUFA, and n-3 HUFA status are illustrated in Fig. 6.
A circadian rhythm is readily apparent for both n-3
HUFA and n-6 HUFA. This component was already
detected with borderline statistical significance for F.
Statistical significance is not reached, however, for
their ratio (n-3 status). One reason may stem from the
fact that n-6 and n-3 change in the same direction.
Synchronized changes of n-6 and n-3 may be due to
changes of lipoproteins that contain both of them in a
given ratio. Another reason may stem from the lack of
statistical power related to the small number of
samples. In the case of F, lower values are found
around mid-day as compared to evening and night.
The disturbed schedule on the day of sampling,
notably in the case of G, may also have played a role,
as the 12-hour component accounted for a larger
proportion of the overall variability than the 24-hour
component in her case.
DISCUSSION
The presence of spontaneous periodic changes in a
number of variables, not only occurring in the
absence of loads ("stress"), but sometimes seemingly
increasing in (or at least being associated with) a very
prominent amplitude when the load of repeated
sampling was removed, was reported over half a
century ago (Halberg and Visscher 1950, see also
Halberg et al. 2003), an important observation as
such, noted by Aschoff (1954). The demonstration
that these rhythms are sensitive gauges of loads
consisted of the finding that the handling of a mouse
for a single venisection (and blood sampling for the
counting of eosinophil cells) carried out at intervals of
several days sufficed to result in eosinopenia
(Halberg 1953).
An odd schedule for G on the day of blood
sampling may account, at least in part, for a 12-hour
over 24-hour predominance in her n-3 index, a marker
of the n-3 HUFA status, and in her BP but not in her
HR data. Whereas HR was characterized by a
statistically significant circadian variation, the
24-hour component was not found for BP, as
illustrated in the least squares spectra of Fig. 7. The
least squares fit of a two-component model consisting
of cosine curves with periods of 24 and 12 hours
accounts for 75% of the overall variance in the case
of HR, but only for 22% and 17% for SBP and DBP,
respectively. A numerically larger 12-hour than
24-hour amplitude is seen for both SBP and DBP.
The fitted models are shown with the data in Fig. 8
(left), where the circadian variation of BP and HR is
aligned with that of the n-3 HUFA status. BP and HR
data collected around the clock with the same
ambulatory monitor at similar about 30-minute
intervals on other Sundays in 2009 were similarly
analyzed. Analyses are restricted to Sundays in view
of differences found earlier between week days and
weekends, the study day being also a Sunday. In all
cases (33 days), the 24-hour component was detected
with statistical significance for SBP and HR, and for
DBP, it was found on 29 of the 33 days. In the
majority of cases, the 24-hour component was the
most prominent in the spectrum (SBP: 30/33; DBP:
23/33; HR: 31/33). A 12-hour prominence was only
seen in 1 and 5 days for SBP and DBP, respectively,
and it did not occur in the case of HR. As seen in Fig.
8 (right), the 24-hour amplitudes of SBP and DBP on
the day of study lie outside the 95% prediction
interval computed on the basis of the results from the
other 33 Sundays, whereas the 24-hour amplitude of
HR lies at the lower limit of the corresponding 95%
prediction interval.
Despite the relatively small number of samples
obtained by finger pricking, a circadian rhythm could
be demonstrated for 65% of the fatty acid related
variables after the data from F and G were expressed
as a percentage of their respective 24-hour mean
values and pooled. The gain in statistical power to
demonstrate a time effect obtained by using relative
rather than original data was already shown in 1953
in a study of endogenous eosinopenia in
institutionalized patients with mental deficiency
(Halberg et al. 1953).
Long-chain PUFAs, especially of the Omega-3
series, in blood lipids are mainly present in relatively
stable pools (i.e., the glycerophospholipids), in turn
incorporated in the lipoproteins and in circulating
cells (mainly erythrocytes' membranes). The various
lipid classes are differently distributed in the
lipoproteins, and have different profiles of long-chain
PUFAs (Rise; et al. 2007). Furthermore, even after
intakes of appreciable amounts, increments of these
fatty acids in blood are rather slow and limited, and,
in addition, they are not actively utilized for energy
purposes, at variance with shorter-chain saturated and
mono-unsaturated fatty acids. It can therefore be
proposed that the observed circadian variations
cannot be attributed to changes in the balance
between intakes and rates of utilization (considering
also that there was no ingestion of Omega-3 PUFA
during the time of the study), but rather to circadian
variations in the pools of fatty acid transporters
(triglycerides, phospholipids and cholesterol esters in
the different lipoproteins, VLDL, LDL, HDL and
chylomicrons). Circadian variations of more labile
lipid pools (i.e., triglycerides; Haus and Touitou
1992), rich in oleic acid, may also account for the
changes in the opposite direction of long-chain PUFA
and oleic acid.
The assessment of the circadian variation in
plasma concentrations of major lipoproteins will be a
useful addition in future studies.
Apart from the relevance of the n-3 status, the
absolute values of n-3 also need proper consideration
in their own right. Indeed, a low n-3 status may be
associated with low n-3 fatty acid values and this is
not ideal. The n-3 values of F and G are lower than
those of an Italian reference population (Table 3),
suggesting the desirability of n-3 supplementation.
Evidence for keeping current n-6 fatty acid intake
as high as presently recommended is lacking. The
current view is to guarantee a certain amount of
long-chain n-3 PUFA intake (>200 mg/day), with no
need for more than 2-3 energy percent of linolenic
acid. Official positions also differ among researchers,
as apparent from discussions at various International
Congresses on fatty acids and lipids such as the one
(7th Congress of the International Society for the
Study of Fatty Acids and Lipids, ISSFAL) held in
June 2006 in Cairns, Australia. There, a whole
morning was devoted to a session entitled "Consensus
and Controversies", in which two opposing groups of
experts presented evidence in favor of or against the
concept of linolenic-acid-rich diets. Presented as
problematic was the fact that under current conditions
of saturation of most if not all fatty acids metabolic
pathways by linolenic acid, the n-6 series of fatty
acids - including linoleic (LA, 18:2) and arachidonic
(AA, 20:4) acids - markedly incorporate in lipid
pools, resulting into low incorporation of long-chain
n-3 fatty acids. On the other hand, the n-3 series of
fatty acids mainly consist of the long-chain PUFA,
eicosapentaenoic acid (EPA), docosapentaenoic acid
(DPA), and docosahexaenoic acid (DHA). Therefore,
to include LA in the total n-6, and to consider the
total n-6 in the calculation of the n-3 status may not
be appropriate. A preferred way to proceed may be to
consider the n-3 HUFA index, a marker of the n-3
HUFA status [Total n-3 HUFA/(Total n-6 HUFA +
Total n-3 HUFA) = 100 x
(EPA+DPA+DHA)/(20:3+20:4AA+22:4+22:5+
EPA+DPA+DHA)]. In this case, neither LA nor
alpha-linolenic acid (ALA) is taken into consideration and
only the fatty acids containing more than 20 carbons
(that are biologically more relevant) are considered.
Since the determination of fatty acids may depend
on prior food intake (Dewailly et al. 1981, Kessler
Cella et al. 1995b, Romon et al. 1997, Rise; et al.
2007, Astorg et al. 2008), the study should be
extended to conditions of equidistant, isocaloric meals
consisting of the same composition in fatty acids. The
aim of the present study, however, was the
assessment of the dynamics under ordinary living
conditions. It should be noted that on the day of
study, F and G had their meals soon after rather than
before blood sampling. For reasons noted at the outset
(Brillat-Savarin 1826, Chossat 1843, Agren et al.
1931, Higgins et al. 1932, 1933, Haus and Halberg
1966, Nelson et al. 1973, Halberg et al. 1995), it
seems unlikely that the demonstration of a circadian
rhythm in the majority of the fatty acids related
variables determined depended solely on meals.
Indeed, complete bed-rest for 36 hours and a 4-hourly
hypo-caloric diet did not abolish the circadian
rhythmicity of physiological functions such as SBP,
HR, or the urinary excretion of
17-hydroxycorticosteroids, potassium, adrenaline,
noradrenaline, and vanillyilmandelic acid in another
study (Reinberg et al. 1970). Similar results were
obtained in another bed-rest study for BP (Halberg et
al. 1988).
These observations prompt questions to their
degree of generality, to secure clinical significance,
apart from mere statistical significance (Cornelissen
et al. 1994), and to inquire about putative underlying
mechanisms and possible implications in research and
practice. This may be done in the context of criticism
of still debated relationships between cholesterol and
cardiovascular disease, in the light of outcomes in the
Framingham study, discussed in a broader view by
Rosch (2001, 2008), Ravnskov et al. (2006),
Ravnskov (2009) and Simopoulos (2009). Studies by
Keys (1970) and their follow-ups (Kromhout et al.
2002, Menotti et al. 2003, 2004a, b, 2007, 2008) are
pertinent. But in all the discussions, whether it is the
role of n-3 fatty acids or that of cholesterol, the
dynamics as yet need clarification (Smolensky et al.
1972, Singh et al. 2003).
A long series of circadian studies of cholesterol
discussed by Dell'Acqua and Gambassi (1960)
already received follow-ups (Singh et al. 1989, 1992).
In India, population circadian rhythms in total,
high-density lipoprotein and low-density lipoprotein
cholesterol were reported in small groups of men and
women 20-25 years of age, sampled every 8 hours for
24 hours (3 samples) under both usual and fasting
conditions (Singh et al. 1989). By contrast, in Italian
data from 20 men and women 15-47 years of age
collected at 3- to 4-hour intervals for 24 hours
(7 samples) (Lippi and Argiolas 1950), a circadian
rhythm in cholesterol could not be demonstrated with
statistical significance. Instead, 12-hour and 8-hour
components accounted for 37.4% and 41.3% of the
overall variance, on the average. In North American
men and women (N = 23, 71 ± 5 years of age) and in
Romanian boys and girls (N = 194, 11 ± 2 years of
age), adults (N = 40, 21 ± 2 years of age) and elderly
(N = 194, 76 ± 8 years of age) of both genders, but
not in English men (N = 20, 22 ± 3 years of age), a
circadian rhythm in cholesterol was shown to peak
around noon (Haus and Touitou 1992), followed
about 6 hours later by triglycerides (Haus and Touitou
1992). Serum concentrations of apolipoprotein,
cholesterol and triglycerides were also reported to
follow a circadian variation in 25 apparently healthy
adults of both genders (29.5 ± 3.6 years of age), the
maximal daily variation (with respect to the daily
mean) ranging from 5% to 63% (Rivera-Coll et al.
1994). Cholesterol synthesis determined in
5 normolipemic men (22-25 years of age) was also
reported to be circadian periodic, assuming near-zero
values in the morning and maximal values around
midnight (Kessler Cella et al. 1995a).
This fledging start of fatty acids dynamics is
presented with the indication that only cost
considerations prompted the sampling limited to a
single 24-hour span and the pooling of data from two
adults of similar age, ethnicity and lifestyle but
different gender and medical history. This report is no
more than an incentive for further work and in no way
does it permit generalization. This feasibility study
was carried out in preparation for a larger study
planned to examine not only the circadian changes in
fatty acids in different age groups, but to extend
sampling along the scales of the week, the seasons,
and beyond, with added focus on effects of fatty acids
on behavior and mental function
(Wilczynska-Kwiatek et al. 2010). It will then
become possible to assess the relative prominence of
circadians versus other anticipated components,
including non-photic ones present in the cosmos,
which have already been documented to characterize
BP and HR (Cornelissen et al. 2007), melatonin
(Cornelissen et al. 2008b), breakdown products of
steroids (Halberg et al. 2008a), and a host of other
variables, including the incidence patterns of
mortality from different causes (Cornelissen et al.
2008a, Halberg et al. 2008b).
The planned larger study will have an opportunity
to assess the merits of different aspects of the
dynamics of fatty acids in the light of various
outcome measures, such as the left ventricular mass
index, total, low-density lipoprotein and high-density
lipoprotein cholesterol, triglycerides, and C-reactive
protein, and their dynamics. Long-term follow-up
may provide additional information on actual
outcomes in terms of morbidity and/or mortality for
a further association with the presence or absence of
various vascular variability disorders to be assessed
from concomitant ambulatory BP and HR monitoring
interpreted chronobiologically. The relative merits of
fatty acids versus cholesterol as biomarkers may thus
gain clarification. A precedent related to BP and HR
monitoring already unveiled vascular variability
disorders not screened for in current medical practice
today that are associated with an increase in
cardiovascular disease risk as large as if not larger
than the risk of an elevated BP (Singh et al. 2003,
Sanchez de la Pena 2008, Halberg et al. 2009).
CONCLUSION
Since the incidence of vascular variability disorders
was found to increase in association with
pre-hypertension and pre-diabetes, it will be
important to see whether any outcome-based
undesired patterns related to the fatty acids and/or to
other lipids, notably cholesterol and triglycerides,
may similarly point toward a pre-metabolic
syndrome, so that dietary countermeasures may be
accordingly designed.
SUPPORT
GM-13981 (FH) and University of Minnesota
Supercomputing Institute (GC, FH).
REFERENCES
Agren G, Wilander O, Jorpes E: Cyclic changes in the glycogen content of the liver and the muscles of rats and mice. Their bearing upon the
sensitivity of the animals to insulin and their influence on the urinary output of nitrogen. Biochem J 25:777-785, 1931.
Aschoff J: Aussprache: Halbergs Untersuchungen. Cited in Halberg F. Beobachtungen uber 24 Stunden-Periodik in standardisierter Versuchsanordnung
vor und nach Epinephrektomie und bilateraler optischer Enukleation, 20th meeting of the German Physiological Society, Homburg/Saar,
September, 1953. Berichte uber die gesamte Physiologie und experimentelle Pharmakologie (Berichte uber die gesamte Biologie, Abteilung B) 162:355,
1954.
Astorg P, Bertrais S, Laporte F, Arnault N, Estaquio C, Galan P, Favier A, Hercberg S: Plasma n-6 and n-3 polyunsaturated fatty acids
as biomarkers of their dietary intakes: a cross-sectional study within a cohort of middle-aged French men and women. Eur J Clin Nutr 62:1155-1161,
2008.
Bernard C: De la diversite des animaux soumis a l'experimentation. De la variabilite des conditions organiques dans lesquelles ils s'offrent a
l'experimentateur. J Anat Physiol Norm Pathol Homme Anim 2:497-506, 1865.
Bernard C: Lecons sur les phenomenes de la vie communs aux animaux et aux vegetaux. JB Bailliere, Paris 1885.
Brillat-Savarin JA: Physiologie du gout, ou, meditations de gastronomie transcendente. Ouvrage theorique, historique et a l'ordre du jour, dedie
aux gastronomes parisiens. A. Soutelet & Co., Paris 1826, vol. I, 390 pp.; vol. II, 442 pp.
Chossat C: Recherches experimentales sur l'inanition. Memoires, Academie Royale des Sciences de l'Institut de France 8:438, 1843.
Cornelissen G, Halberg F: Chronomedicine. In Armitage P, Colton T (eds.): Encyclopedia of Biostatistics, 2nd ed., John Wiley & Sons
Ltd., Chichester 2005, pp. 796-812.
Cornelissen G, Sothern RB, Wendt HW, Tarquini B, Antunano M, Siegelova J, Fiser B, Dusek J, Prikryl P, Halberg F: Statistical significance without
biologic signification is not enough: illustrative example. Chronobiologia 21:315-320, 1994.
Cornelissen G, Halberg F, Rostagno C, Otsuka K: A chronomic approach to cardiac arrhythmia and sudden cardiac death. J Auton Nerv Syst 44:251-254,
2007.
Cornelissen G, Halberg F, Singh RB, and the international BIOCOS (The Biosphere and the Cosmos) project: Unseen space weather also relates to
cardiac events. World Heart J 1:15-21, 2008a.
Cornelissen G, Tarquini R, Perfetto F, Otsuka K, Gigolashvili M, Halberg F: About 5-month cycle in human circulating melatonin: signature of
weather in extraterrestrial space? Poster presentation, Fourth UN/ESA/NASA/JAXA Workshop on the International Heliophysical Year 2007 and Basic
Space Science: "First Results from the International Heliophysical Year 2007", Sozopol, Bulgaria, June 2-6, 2008b.
Dell'Acqua G, Gambassi G: Le variazioni giornaliere della sintesi de colesterolo. Estratto dal Volume degli "Atti", VII Conferenza Internazionale
della Societa per lo Studio dei Ritmi Biologici inclusa la Basimetria, Siena, Italy, 5-7 Settembre 1960, pp. 1-3.
De Meester F: Progress in lipid nutrition: the Columbus concept addressing chronic diseases. In Simopoulos AP, De Meester F (eds.): A Balanced
Omega-6/Omega-3 Fatty Acid Ratio, Cholesterol and Coronary Heart Disease. World Review of Nutrition and Dietetics, Vol. 100, Karger, Basel 2009,
pp. 110-121.
Dewailly P, Moulin S, Fievet C, Dedonder E, Sezille G, Jaillard J: Variations nycthémérales des lipoprotéines chez le sujet normal en fonction des
repas. Nouv Presse Med 10:1913-1914, 1919-1921, 1981.
Dubnov G, Pella D, Singh RB: The effect of an alfa-linolenic-acid-rich diet on the circadian rhythm of cardiac events. World Heart J 1:49-56,
2008.
Galli C, Calder PC: Effects of fat and fatty acid intake on inflammatory and immune responses: a critical review. Ann Nutr Metab 55:123-139,
2009.
Galli C, Rise P, Ghezzi S, Marangoni F: Fast determination of fatty acids in whole blood collected from fingertips: Application to the assessment
of fatty acids patterns (and various indexes) in population studies. In Simopoulos AP, De Meester F (eds.): A Balanced Omega-6/Omega-3 Fatty Acid
Ratio, Cholesterol and Coronary Heart Disease. World Rev Nutr Diet, Vol. 100, Karger, Basel 2009, pp. 35-45.
Halberg F: Changes in eosinophil count of mice with venisections repeated at intervals of several days. Proc Soc Exp Biol Med 82:160-162,
1953.
Halberg F: Physiologic 24-hour periodicity; general and procedural considerations with reference to the adrenal cycle. Z Vitam Hormon Fermentforsch
10:225-296, 1959.
Halberg F: Chronobiology. Annu Rev Physiol 31:675-725, 1969.
Halberg F: Chronobiology: methodological problems. Acta Med Rom 18:399-440, 1980.
Halberg F, Visscher MB: Regular diurnal physiological variation in eosinophil levels in five stocks of mice. Proc Soc Exp Biol NY 75:846-847,
1950.
Halberg F, Engel R, Treloar AE, Gully RJ: Endogenous eosinopenia in institutionalized patients with mental deficiency. AMA Arch Neurol Psychiatry
69:462-469, 1953.
Halberg F, Cornelissen G, Halberg E, Halberg J, Delmore P, Shinoda M, Bakken E: Chronobiology of human blood pressure. Medtronic Continuing Medical
Education Seminars, 4th ed. Medtronic Inc., Minneapolis 1988, 242 pp.
Halberg F, Haus E, Cornelissen G: From biologic rhythms to chronomes relevant for nutrition. In Marriott BM (ed.): Not Eating Enough: Overcoming
Underconsumption of Military Operational Rations. National Academy Press, Washington DC 1995, pp. 361-372.
Halberg F, Cornelissen G, Katinas G, Syutkina EV, Sothern RB, Zaslavskaya R, Halberg F, Watanabe Y, Schwartzkopff O, Otsuka K, Tarquini R, Perfetto
P, Siegelova J: Transdisciplinary unifying implications of circadian findings in the 1950s. J Circadian Rhythms 1:2, 2003, 61 pp.
Halberg F, Cornelissen G, Schwartzkopff O: Quo vadis chronomics 2008: Measuring variability in us, among us and around us. In Halberg F, Kenner T,
Fiser B, Siegelova J (eds.): Proceedings, Noninvasive Methods in Cardiology, Brno, Czech Republic, October 4-7, 2008a, pp. 16-25.
Halberg F, Cornelissen G, Sothern RB, Katinas GS, Schwartzkopff O, Otsuka K: Cycles tipping the scale between death and survival (= "life"). Progr
Theorl Phys 173 (Suppl.):153-181, 2008b.
Halberg F, Cornelissen G, Otsuka K, Siegelova J, Fiser B, Dusek J, Homolka P, Sanchez de la Pena S, Singh RB: BIOCOS project. Extended consensus on
need and means to detect vascular variability disorders (VVDs) and vascular variability syndromes (VVSs). Geronto-Geriatrics: Int J
Gerontology-Chronome Geriatrics 11:119-146, 2008c.
Halberg F, Cornelissen G, Otsuka K, Siegelova J, Fiser B, Dusek J, Homolka P, Sanchez de la Pena S, Singh RB: BIOCOS project. Extended consensus on
means and need to detect vascular variability disorders (VVDs) and vascular variability syndromes (VVSs). Leibniz-Online 5, 2009, 35 pp.
Haus E, Halberg F: Persisting circadian rhythm in hepatic glycogen of mice during inanition and dehydration. Experientia 22:113-114, 1966.
Haus E, Touitou Y: Chronobiology in laboratory medicine. In Touitou Y, Haus E (eds.): Biological Rhythms in Clinical and Laboratory Medicine,
Springer-Verlag, Berlin 1992, pp. 673-708.
Higgins GM, Berkson J, Flock E: The diurnal cycle in the liver: I. Periodicity of the cycle, with analysis of chemical constituents involved. Am J
Physiol 102:673-682, 1932.
Higgins GM, Berkson J, Flock E: The diurnal cycle in the liver of the white rat: II. Food, a factor in its determination. Am J Physiol 105:177-186,
1933.
Kessler Cella L, Van Cauter E, Schoeller DA: Diurnal rhythmicity of human cholesterol synthesis: normal pattern and adaptation to simulated "jet
lag". Am J Physiol 269:E489-E498, 1995a.
Kessler Cella L, Van Cauter E, Schoeller DA: Effect of meal timing on diurnal rhythm of human cholesterol synthesis. Am J Physiol 269:E878-E883,
1995b.
Keys A: Coronary heart disease in seven countries. Circulation 41 (Suppl. 1):1-211, 1970.
Kromhout D, Menotti A, Blackburn H: Prevention of Coronary Heart Disease. Diet, Lifestyle and Risk Factors in the Seven Countries Study. Kluwer
Academic Publ., Boston 2002, 267 pp.
Lagarde M: Docosahexaenoic acid: nutrient and precursor of bioactive lipids. Eur J Lipid Sci Technol 110: 673-678, 2008.
Lippi M, Argiolas L: La colesterina nelle 24 ore in sogetti normale. Minerva Med 42:307-312, 1950.
Marangoni F, Colombo C, Galli C: A method for the direct evaluation of the fatty acid status in a drop of blood from a fingertip in humans:
applicability to nutritional and epidemiological studies. Anal Biochem 326:267-272, 2004.
Marangoni F, Colombo C, Martiello A, Negri E, Galli C: The fatty acid profiles in a drop of blood from a fingertip correlate with physiological,
dietary and lifestyle parameters in volunteers. Prostaglandins Leukot Essent Fatty Acids 76:87-92, 2007.
Menotti A, Puddu PE, Lanti M, Kromhout D, Blackburn H, Nissinen A: Twenty-five-year coronary mortality trends in the Seven Countries Study using
the accelerated failure time model. Eur J Epidemiol 18:113-122, 2003.
Menotti A, Kromhout D, Blackburn H, Jacobs D, Lanti M: Early and late coronary deaths in the US Railroad study predicted by major coronary risk
factors. Eur J Cardiovasc Prev Rehabil 11:382-388, 2004a.
Menotti A, Kromhout D, Blackburn H, Jacobs D, Lanti M: Forty-year mortality from cardiovascular diseases and all causes of death in the US Railroad
cohort of the Seven Countries Study. Eur J Epidemiol 19:417-424, 2004b.
Menotti A, Lanti M, Kromhout D, Blackburn H, Nissinen A, Dontas A, Kafatos A, Nedeljkovic S, Adachi H: Forty-year coronary mortality trends and
changes in major risk factors in the first 10 years of follow-up in the Seven Countries Study. Eur J Epidemiol 22:747-754, 2007.
Menotti A, Lanti M, Kromhout D, Blackburn H, Jacobs D, Nissinen A, Dontas A, Kafatos A, Nedeljkovic S, Adachi H: Homogeneity in the relationship of
serum cholesterol to coronary deaths across different cultures: 40-year follow-up of the Seven Countries Study. Eur J Cardiovasc Prev Rehabil
15:719-725, 2008.
Nelson W, Cadotte L, Halberg F: Circadian timing of single daily "meal" affects survival of mice. Proc Soc Exp Biol Med 144:766-769, 1973.
Ratnayake WMN, Galli C: Fat and fatty acid terminology, methods of analysis and fat digestion and metabolism: a background review paper. Ann Nutr
Metab 55:8-43, 2009.
Ravnskov U: Cholesterol was healthy in the end. In Simopoulos AP, De Meester F (eds.): A Balanced Omega-6/Omega-3 Fatty Acid Ratio, Cholesterol and
Coronary Heart Disease. World Review of Nutrition and Dietetics, Vol. 100, Karger, Basel 2009, pp. 90-109.
Ravnskov U, Rosch PJ, Sutter MC, Houston MC: Should we lower cholesterol as much as possible? Brit Med J 332:1330-1332, 2006.
Refinetti R, Cornelissen G, Halberg F: Procedures for numerical analysis of circadian rhythms. Biol Rhythm Res 38:275-325, 2007.
Reinberg A, Ghata J, Halberg F, Gervais P, Abulker C, Dupont J, Gaudeau C: Rythmes circadiens du pouls, de la pression artérielle, des excrétions
urinaires en 17-hydroxycorticosteroides, catecholamines et potassium chez l'homme adulte sain, actif et au repos. Ann Endocrinol (Paris)
31:277-287, 1970.
Rise P, Salvetti F, Galli C: Application of a direct transmethylation method to the analysis of fatty acid profile in circulating and cultured
cells. Anal Biochem 346:182-184, 2005.
Rise P, Eligini S, Ghezzi S, Colli S, Galli C: Fatty acid composition of plasma, blood cells and whole blood: relevance for the assessment of the
fatty acid status in humans. Prostaglandins Leukot Essent Fatty Acids 76:363-369, 2007.
Rivera-Coll A, Fuentes-Arderiu X, Diez-Noguera A: Circadian rhythmic variations in serum concentrations of clinically important lipids. Clin Chem
40:1549-1553, 1994.
Romon M, Le Fur C, Lebel P, Edme JL, Fruchart JC: Circadian variation of postprandial lipemia. Am J Clin Nutr 65:934-940, 1997.
Rosch PJ: Letter in response to Guidelines for diagnosis and treatment of high cholesterol. JAMA 286:2401, 2001.
Rosch PJ: Cholesterol does not cause coronary heart disease in contrast to stress. Scand Cardiovasc J 42:244-249, 2008.
Sanchez de la Pena S (ed.): Geronto-Geriatrics. Int J Gerontology-Chronome Geriatrics 11:110-185, 2008.
Simopoulos AP: Preface. In Simopoulos AP, De Meester F (eds.): A Balanced Omega-6/Omega-3 Fatty Acid Ratio, Cholesterol and Coronary Heart Disease.
World Review of Nutrition and Dietetics, Vol. 100, Karger, Basel 2009, pp. IX-XV.
Singh RB, Cornelissen G, Weydahl A, Schwartzkopff O, Katinas G, Otsuka K, Watanabe Y, Yano S, Mori H, Ichimaru Y, Mitsutake G, Pella D, Fanghong L,
Zhao Z, Rao RS, Gvozdjakova A, Halberg F: Circadian heart rate and blood pressure variability considered for research and patient care. Int J
Cardiol 87:9-28, 2003.
Singh RK, Wu J, Zhou S, Halberg F: Circadian rhythmic human circulating cholesterol in health, during fasting and on vegetarian vs. omnivorous
diets. Chronobiologia 16:183, 1989.
Singh RK, Mahdi AA, Singh AK, Bansal SK, Wu J, Zhou S, Halberg F: Circadian variation of human circulating cholesterol components on vegetarian and
omnivorous diets in healthy Indians. Indian J Clin Biochem 7:185-192, 1992.
Smolensky M, Halberg F, Sargent F II: Chronobiology of the life sequence. In Itoh S, Ogata K, Yoshimura H (eds.): Advances in Climatic Physiology,
Igaku Shoin Ltd., Tokyo 1972, pp. 281-318.
Stark KD: The percentage of n-3 Highly Unsaturated Fatty Acids in total HUFA as a biomarker for omega-3 fatty acid status in tissues. Lipids
43:45-53, 2008.
Wilczynska-Kwiatek A, Singh RB, De Meester F: Nutrition and behaviour: The role of omega-3 fatty acids. Open Nutraceut J 3:119-128, 2010.
Yehuda S, Rabinovitz S, Mostofsky DI: Essential fatty acids and the brain: From infancy to aging. Neurobiol Aging 26S:S98-S102, 2005.
|
BACK
|


