Journal of APPLIED BIOMEDICINE
ISSN 1214-0287 (on-line)
ISSN 1214-021X (printed)
Volume 9 (2011), No 2, p 103-109
DOI 10.2478/v10136-009-0032-6
Square wave voltammetry on screen printed electrodes: comparison to ferric reducing antioxidant power in plasma from model laboratory animal (Grey Partridge) and comparison to standard antioxidants
Miroslav Pohanka, Hana Bandouchova, Kristina Vlckova, Jana Zdarova Karasova, Kamil Kuca, Veronika Damkova, Lucie Peckova, Frantisek Vitula, Jiri Pikula
Address: Miroslav Pohanka, Faculty of Military Health Sciences, University of Defence, Trebesska 1575, 500 01 Hradec Kralove, Czech Republic
miroslav.pohanka@gmail.com
Received 24th May 2010.
Revised 1st July 2010.
Published online 23rd November 2010.
Full text article (pdf)
Abstract in xml format
Summary
Key words
Introduction
Experimental
Results and discussion
Conclusions
Acknowledgements
References
SUMMARY
Low molecular weight antioxidants (LMWAs) were assayed by square wave voltammetry (SWV) using screen printed electrodes. Standard antioxidants, i.e. uric acid, ascorbic acid, trolox and glutathione, were assayed in order to estimate the sensitivity and standard redox potentials of individual LMWAs. In another experiment, plasma from Grey Partridges was used as model real samples. Ferric reducing antioxidant power (FRAP) was used as a reference method. Two peaks in plasma samples were found by SWV and correlated to FRAP. The SWV peaks were successfully correlated to FRAP. The practical importance of SWV carried out on screen printed electrodes is discussed.
KEY WORDS
electrochemistry; antioxidant assay; oxidative stress; reactive oxygen species; avian blood; biochemistry
INTRODUCTION
Low molecular weight antioxidants (LMWAs) are
chemical compounds which are easily oxidized and
protect other molecules from oxidization (Podda and
Grundmann-Kollmann 2001). Physiologically most
relevant antioxidants include tocopherol, retinol,
ascorbic acid, glutathione, cysteine and uric acid
(Finaud et al. 2006). In addition to the LMWAs,
enzymatic antioxidants play an important role in the
protection of the organism. The enzymes participating
in LMWA reactivation, such as glutathione reductase,
represent one group, and other enzymes catalyze the
splitting of reactive oxygen species (ROS):
superoxide dismutase splitting superoxide, or catalase
splitting hydrogen peroxide. Enzymes catalyzing the
reaction between ROS and LMWAs represent the last
group participating in the protection against oxidative
stress (Gilca et al. 2007), and glutathione peroxidase
is a typical example of this group.
There are a number of reasons why levels of
endogenous antioxidants may be increased. Oxidative
stress burden is a common cause, perhaps as a
consequence of exposure to drugs (Bandouchova et
al. 2009). Stress accompanied by an increase in
antioxidants is found in individuals exposed to toxins
or infectious agents (Nemsadze et al. 2009, Pohanka
et al. 2009a). The relationship between ageing and
enzymatic antioxidants as well as LMWAs has also
been extensively investigated (Khansari et al. 2009)
and methods suitable for the fast and reliable assay of
antioxidants have been established. Enzymatic
antioxidants are assayed with respect to their
catalytical activity or specific antibodies finding
distinct regions in their structure, and LMWAs are
typically assayed using their redox potency. Specific
studies have been carried out on chromatographic
devices where individual antioxidants can be
distinguished, but the disadvantages of such
techniques are the cost and time needed for each
assay (Takemoto et al. 2009).
Probably two photometrical methods are most
common for the estimation of antioxidant potency.
The first is the oxygen radical absorbance capacity
(ORAC), and the second is the ferric reducing
antioxidant power (FRAP). ORAC is based on
fluorescein damage and a decrease in fluorescence in
the presence of the oxidant and its protection due to
the antioxidant in the sample. The antioxidant
potency is then recounted into a trolox equivalent
(Predka and Gronowska-Senger 2009). The FRAP
method is a direct one. Antioxidants in the assayed
sample reduce FeIII+ to FeII+. Accumulated FeII+
interacts with 2,4,6-tris(2pyridyl)-s-triazine (TPTZ)
providing complex absorption at 593 nm. A selective
method for assay of reduced glutathione (GSH) and
cysteine is the Ellman method which employs
5,5´-dithiobis(2nitrobenzoic acid) (DTNB hereinafter)
which in turn provides yellow 5-thio-2-nitrobenzoic
acid (TNB). Voltammetric methods are considered a
promising method of analysing LMWAs, and cyclic
voltammetry, differential pulse voltammetry and
square voltammetry (SWV) have been performed by
many authors to measure LMWAs in biological
matrices (Shohami et al. 1997, Chevion and Chevion
2000, Huang et al. 2004, Vacek et al. 2004, Adam et
al. 2007, Pohanka and Stetina 2009).
The present study has two aims. The first is to
estimate standard LMWAs in a sample using SWV
and screen printed electrodes. The second aim is to
perform SWV on real samples, i.e. plasma from the
Grey Partridge. The suitability of SWV for the assay
of LMWAs in plasma samples was confirmed by the
standard FRAP test. Grey Partridges were chosen as
an appropriate model allowing collection of blood
samples in sufficient amounts and moreover, grey
partridges are animals used as environmental models
(Acevedo et al. 2007).
EXPERIMENTAL
Animal manipulation, blood collection and
processing
Healthy Grey Partridges (Perdix perdix) kept at the
Game Bird Farm of the Veterinary and
Pharmaceutical University Brno, Czech Republic
were employed in the study. Partridges were supplied
with a feeding mixture and drinking water ad libitum.
The animals used in experiment were a sub-group of
another experiment and the blood used was an
aliquot. This approach allowed a saving not only in
costs but also in the number of animals needed for
experimental purposes. The whole experiment was
permitted and supervised by the ethical committee of
the Veterinary and Pharmaceutical University Brno.
Blood was collected from the ulnaris vein, taken
into tubes with heparin, and centrifuged at 2,000xg
for 5 minutes. The plasma was separated and used
immediately for the assay of LMWAs, or stored at
-80 °C. The frozen plasma was processed within one
month in order to avoid spontaneous degradation of
antioxidants. The pH value of plasma samples was
7.4 as confirmed by a standard pH selective
potentiometric electrode.
Ferric reducing antioxidant power assay
Minor modifications in methods referred to in Chen
et al. (2007) and Szydlowska-Czerniak et al. (2008)
were made to estimate the FRAP. 2,4,6-tris
(2pyridyl)-s-triazine (TPTZ) containing reagent
solution was prepared shortly before measurement.
The mixture was composed of 2.5ml of 10 mM TPTZ
in 40 mM HCl mixed with 20 mM FeCl3 dissolved in
another 2.5 ml of water. Finally, 25 ml of 0.1 M
acetate buffer of pH 3.6 was added. The mixture was
heated to 37 °C for 10 minutes. After that, 30 microl of a
plasma sample or phosphate buffered saline (as blank;
abbreviated PBS) were added into 200 l of TPTZ
containing reagent solution and, as the last step, 1 ml
of distilled water was injected into the solution. The
mixture was incubated for 10 minutes and centrifuged
at 10,000xg for another ten minutes. Supernatant
absorbance was measured at 593 nm against the fresh
blank.
Square wave voltammetry assay
Square wave voltammetry (SWV) was used to
estimate LMWAs in plasma without any
pre-treatment of samples. Screen printed sensors
(BVT, Brno, Czech Republic) containing platinum
working (diameter 1 mm, dot shaped), platinum
auxiliary (circle shaped) and silver covered with
silver chloride reference (circle shaped) electrodes
were used throughout experiments. The electrochemical assay was processed by an electrochemical
analyser (EmStat, PalmSens, Houten, Netherlands).
The electrochemical strips were washed by ethanol
prior to use and the strips were used in a disposable
way in order to avoid hysteresis. The potential range
of SWV was 0-1 V with potential step and amplitude
of 10 mV and frequency of 1 Hz. The strips were
fixed horizontally and electrodes were covered with
20 microl of the analyzed plasma sample. Experimental
curves were processed using the PSLite software
(PalmSens).
RESULTS AND DISCUSSION
Assay of standard antioxidants
In the first phase of the study, the suitability of SWV
on screen printed electrodes for standards of
antioxidants was examined. The antioxidants ascorbic
acid, glutathione and uric acid were chosen as they
are typically widely found in the body. Trolox was
chosen as a water soluble derivate of tocopherol
(Olsewska and Michel 2009). The example of real
voltammograms is clearly depicted as Fig. 1. The
antioxidants diluted in phosphate buffered saline
(PBS) were adjusted in a wide range covering at least
the expected physiological concentrations in the
blood or plasma. The regression of SWV versus
standard antioxidants is depicted as semi logarithmic
calibration in Fig. 2.
The most relevant value able to provide
qualitative information of the sample analyzed was
considered to be the peak position. The limit of
detection (LOD) and correlation for individual assays
are taken for other valuable information. The applied
voltage for maximal oxidation of the selected
antioxidants can be divided into two basic intervals.
The lower one is up to 500 mV and ascorbic (344±42
mV) as well as uric (455±29 mV) acids are
contributors to that. Trolox (670±23 mV) and
glutathione (764±17 mV) are oxidized at a higher
applied voltage. Though trolox and glutathione peak
positions would be considered as overlaid, the
interference in a biological sample is not really
anticipated since trolox is a man made derivative of
poorly soluble tocopherol occurring typically in cell
membranes in vivo (Polyzos et al. 2007).
The LOD is another important analytical
parameter. The best limit of detection was achieved
for trolox and glutathione. Uric acid was found in
levels approximately two to three times higher than
the above mentioned. The poorest limit of detection
was found for ascorbic acid. The limits of detection
were low enough to recognize the physiological values of the antioxidants. Correlation coefficients
confirmed the analytical suitability of SWV for assay.
They varied from 0.931 (ascorbic acid) to the highly
significant 0.997 (uric acid). The SWV is definitely
responsible for the change in the antioxidants
although the curves were shaped in a different grade
when compared with each other. According to the
data included, the SWV on screen printed electrodes
was confirmed as a suitable tool for assay of
antioxidants.

Fig. 1. Real voltammograms achieved by SWV. The
curves represent assay of the antioxidant trolox in
concentrations 10-2, 10-3, 10-4, and 10-5 mol/l.
Antioxidants levels in biological matrices
represented by the Grey Partridge plasma
The Grey Partridge is a model organism frequently
used in environmental studies. The plasma samples
were collected as mentioned in the experimental
section and assayed by both FRAP and SWV in order
to assess suitability for clinical analysis. The typical
peak heights and positions are clearly shown in the
Fig. 3. There are two peaks found at positions 476±43
and 745±35 mV. According to the optimisation and
finding of standard antioxidant redox peaks,
glutathione can be identified as an important
contributor to the second (b) peak (745±35 versus the
standard value 764±17 mV), whereas uric acid mainly
seems to be forming the first (a) peak (476±43 versus
the standard value 455±29 mV). The peaks b and
peak of glutathione respectively peak a and uric acid
are significantly overlaid and can be identified
accordingly.

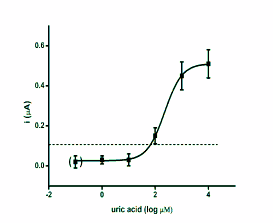
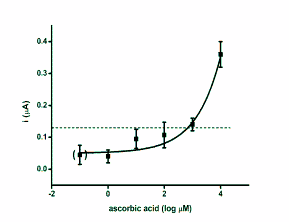
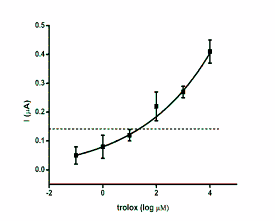
Fig. 2. Calibration curves for antioxidants glutathione,
ascorbic acid, uric acid and trolox. The achieved current
against antioxidants logarithmic concentration was
extrapolated. The point in brackets represents control
(phosphate buffered saline). Dashed lines indicate the limit
of detection (signal to noise ratio equal to three). Error bars
were calculated as standard deviation for quadruplicate.
The plasma samples were repeatedly analysed by
both FRAP and SWV. Peaks a as well as peaks b
achieved in the correlation between FRAP and SWV are clearly depicted in Fig. 4. As seen on the
calibration, the peak a achieved by SWV was found
to be clearly correlated to the FRAP value of the same
plasma samples. The correlation coefficient for five
plasma samples, each assayed four times, was 0.903.
In contrast, the peak b value was quite stable and the differences between glutathione levels in individual
partridges were minimal. There was a low
significance correlation to the FRAP; the correlation
coefficient was only 0.234. The reason for this effect
could be the low fluctuation of the reduced
glutathione in the plasma samples. The Ellman assay
of thiols was carried out to confirm this (Navarova et
al. 2008, Paškova et al. 2008). The pure DTNB was
used as stated in the references with minor adaptation.
The molar concentration of thiols was calculated from
absorbance at 412 nm. The levels of thiols were
4.04-5.11×10⁻⁴ mol/l in the tested plasma samples.
This fact confirms the suspicion that reduced
glutathione is not strongly changed as indicated by
SWV.

Fig. 3. Example of SWV for the Grey Partridge plasma
sample. According the text, the peaks are labelled as a
and b.
Table 1. Basic analytical parameters of antioxidants assay. U represents peak position, LOD limit of detection, and R
correlation coefficients of calibrations shown above.
| U (mV) |
LOD (mol/l) |
R |
| ascorbic acid |
344±42 |
6.30×10⁻⁴ |
0.931 | | glutathione |
764±17 |
2.82×10⁻⁵ |
0.993 | | trolox |
670±23 |
2.47×10⁻⁵ |
0.988 | | uric acid |
455±29 |
6.46×10⁻⁵ |
0.997 |
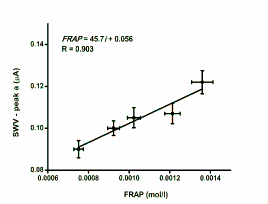
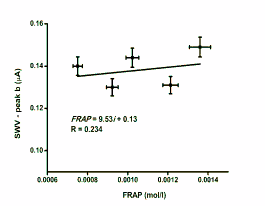
Fig. 4. Correlation of SWV to FRAP. Peaks a and b
represent currents achieved at 476±43 and 745±35 mV,
respectively. Error bars were achieved by tetraplicate
measurement and indicate standard deviation.
The currents found at peaks a and b were
summarized and the sum of the current was plotted
against FRAP values. As can be seen in Fig. 5, the
sum of currents was well correlated to FRAP. The
correlation coefficient was even higher when
correlating the peak a to FRAP only. The value of
correlation coefficient found was 0.971. It is probably
due to the reduced glutathione impact on total
antioxidant power of plasma. Though the reduced
glutathione changed its level in a lower scale when
compared to the other LMWAs, its total level is quite
high and even low changes can cause the
smoothening of the correlation introduced in Fig. 5.
SWV based on screen printed electrodes was
found to be fully suitable for the fast and precise
assay of LMWAs. Moreover, the assay is able to
provide a simple distinction of the LMWAs into two
basic groups including the most important
antioxidants. The most relevant advantage of SWV is
the fact that there is no need to use any reagents or
pre-treatment of samples as typical for
chromatography methods (Teixeira et al. 2009,
Kurzawa 2010). SWV especially allows the process
of samples without the extraction typical for the
processing of biological matrices (Jin et al. 2010).
Other interferences in plasma samples are not
expected. Previous experiments aimed at the
evaluation of direct oxidative stress markers and
reduced antioxidants produce a lower potential
(Pohanka and Stetina 2009); e.g. hydroperoxides and organic peroxides have a peak in the anodic range at
a potential of around -1000 mV (Evans 1999).

Fig. 5. Correlation of the sum of peak currents achieved
by SWV to FRAP. Error bars were achieved by
tetraplicate measurement and indicate standard deviation.
The overall time needed per assay is lower than
three minutes when compared to the approximately
two hours of manipulation required for the FRAP
assay. The minimal consumption of samples can be
mentioned as another advantage and point to the
suitability of screen printed and composite electrode
based sensors for practical performance (Pohanka and
Skladal 2008, Pohanka et al. 2008, 2009b, Freitas et
al. 2009).
CONCLUSIONS
SWV based on screen printed electrodes was found
suitable for the assay of low molecular weight
antioxidants. The assay was successfully performed
on standard antioxidants such as trolox, ascorbic acid,
uric acid, and glutathione. Limits of detection and
redox peaks for antioxidant standards were both
investigated. The practical suitability of SWV was
performed on real plasma samples. SWV fully
corresponds to the standard FRAP assay. In
comparison to the FRAP assay, LMWAs in plasma
samples can be analysed by SWV without any
reagents or pre-treatment of samples. The time needed
for one assay is significantly shorter for SWV when
compared with FRAP. The low consumption of the
plasma sample and no sensitivity to interference of
the other oxidative stress markers can be mentioned
as other advantages.
ACKNOWLEDGEMENTS
The present study was supported by the Ministry of
Education, Youth, and Sports of the Czech Republic,
Grant No. 6215712402 and Ministry of Defense of
the Czech Republic, Grant No. FVZ0000604.
REFERENCES
Acevedo P, Alzaga V, Cassinello J, Gortazar C. Habitat suitability modelling reveals a strong niche overlap between two poorly known species, the broom hare and the Pyrenean grey partridge, in the north of Spain. Acta Oecol Int J Ecol. 31: 174-184, 2007.
[CrossRef]
Adam V, Mikelova R, Hubalek J, Hanustiak P, Beklova M, Hodek P, Horna A, Trnkova L, Stiborova M, Zeman L, Kizek R. Utilizing of square wave voltammetry to detect flavonoids in the presence of human urine. Sensors. 7: 2402-2418, 2007.
[CrossRef]
Bandouchova H, Sedlackova H, Pohanka M, Novotny L, Hubalek M, Treml F, Vitula F, Pikula J. Tularemia induces different biochemical responses in BALB/c mice and common voles. BMC Infect Dis. 9: 101, 2009.
[CrossRef]
[PubMed]
Chen C, Arjomandi M, Balmes J, Tager I, Holland N. Effects of chronic and acute ozone exposure on lipid peroxidation and antioxidant capacity in healthy young adults. Environ Health Perspect. 115: 1732-1737, 2007.
[CrossRef]
[PubMed]
Chevion S, Chevion M. Antioxidant status and human health. Use of cyclic voltammetry for the evaluation of the antioxidant capacity of plasma and of edible plants. Ann NY Acad Sci. 899: 308-325, 2000.
[CrossRef]
Evans O. On-line deoxygenation in reductive (and oxidative) amperometric detection: environmental applications in the liquid chromatography of organic peroxides. Analyst. 124: 1811-1816, 1999.
[CrossRef]
Finaud J, Lac G, Filaire E. Oxidative stress: relationship with exercise and training. Sports Med. 36: 327-358, 2006.
[CrossRef]
[PubMed]
Freitas KHG, Medeiros RA, Fatibello-Filho O. Voltammetric determination of rutin using a carbon composite electrode modified with copper (II) resin. Anal Lett. 42: 881-897, 2009.
[CrossRef]
Gilca M, Stoian I, Atanasiu V, Virgolici B. The oxidative hypthesis of senescence. J Postgrad J Med. 53: 207-213, 2007.
[CrossRef]
[PubMed]
Huang T, Gao P, Hageman MJ. Rapid screening of antioxidants in pharmaceutical formulation developing using cyclic voltammetry - potential and limitations. Curr Drug Discov Technol. 1: 173-179, 2004.
[CrossRef]
[PubMed]
Jin ZM, Bi HQ, Liang NN, Duan CQ. An extract method for obtaining the maximum non-anthocyanin phenolics from grape berry skins. Anal Lett. 43: 776-785, 2010.
[CrossRef]
Khansari N, Shakiba Y, Mahmoudi M. Chronic inflammation and oxidative stress as a major cause of age-related diseases and cancer. Recent Pat Inflamm Allergy Drug Discov. 3: 73-80, 2009.
[CrossRef]
Kurzawa M. Determination of quercetin and rutin in selected herbs and pharmaceutical preparations. Anal Lett. 43: 993-1002, 2010.
[CrossRef]
Navarova J, Schmidtova M, Ujhazy E, Dubovicky M, Mach M. Selected biochemical variables in a model of neonatal anoxia in rats. Neuro Endocrinol Lett. 27 (Suppl. 2): 78-81, 2008.
Nemsadze K, Sanikidze T, Ratiani L, Gabunia L, Sharashenidze T. Mechanisms of lead-induced poisoning. Georgian Med News. 172: 92-96, 2009.
Olsewska MA, Michel P. Antioxidant activity of inflorescences, leaves and fruits of three Sorbus species in realation to their polyphenolic composition. Nat Prod Res. 23: 1507-1521, 2009.
[CrossRef]
[PubMed]
Paskova V, Adamovsky O, Pikula J, Skocovska B, Bandouchova H, Horakova J, Babica J, Marsalek B, Hilscherova K. Detoxification and oxidative stress responses along with microcystins accumulation in Japanese quail exposed to cyanobacterial biomass. Sci Total Environ. 398: 34-47, 2008.
[CrossRef]
[PubMed]
Podda M, Grundmann-Kollmann M. Low molecular weight antioxidants and their role in skin ageing. Clin Exp Dermatol. 26: 578-582, 2001.
[CrossRef]
[PubMed]
Pohanka M, Skladal P. Electrochemical biosensors - principles and applications. J Appl Biomed. 6: 57-64, 2008.
[JAB]
Pohanka M, Stetina R. Shift of oxidants and antioxidants levels in rats as a reaction to exposure to sulfur mustard. J Appl Toxicol. 29: 643-647, 2009.
[CrossRef]
[PubMed]
Pohanka M, Jun D, Kuca K. Amperometric biosensors for real time assays of organophosphates. Sensors. 8: 5303-5312, 2008.
[CrossRef]
Pohanka M, Zdarova Karasova J, Musilek K, Kuca K, Kassa J. Effect of five acetylcholinesterase reactivators on tabun-intoxicated rats: induction of oxidative stress versuss reactivation efficacy. J Appl Toxicol. 29: 483-488, 2009a.
[CrossRef]
[PubMed]
Pohanka M, Musilek K, Kuca K. Progress of Biosensors based on cholinesterase inhibition. Curr Med Chem. 16: 1790-1798, 2009b.
[CrossRef]
[PubMed]
Polyzos NP, Mauri D, Tsappi M, Tzioras S, Kamposioras K, Cortinovis I, Casazza G. Combined vitamin C and E supplementation during pregnancy for preeclampsia prevention: a systematic review. Obster Gynecol Surv. 62: 202-206, 2007.
[CrossRef]
Predka A, Gronowska-Senger A. Antioxidant properties of selected vegetables from organic and conventional system of cultivation in reducing oxidative stress. Zywnosc-Nauka Technologia Jakosc. 16: 9-18, 2009.
Shohami E, Beit-Yannai E, Horowitz M, Kohen R. Oxidative stress in closed-head injury: brain antioxidant capacity as an indicator of functional outcome. J Cereb J Blood Flow Metab. 17: 1007-1019, 1997.
[CrossRef]
Szydlowska-Czerniak A, Dianoczki C, Recseg K, Karlovits G, Szlyk E. Determination of antioxidant capacities of vegetable oils by ferric-ion spectrophotometric methods. Talanta. 76: 899-905, 2008.
[CrossRef]
[PubMed]
Takemoto E, Filha JT, Godoy HT. Validation of methodology for the simultaneous determination of synthetic antioxidants in vegetables oils, margarine and vegetables hydrogenated fats by HPLC/UV. Quim Nova. 32: 1189-1194, 2009.
[CrossRef]
Teixeira DM, Canelas VC, Canto AM, Teixeira JMG, Dias CB. HPLC-DAD Quantification of phenolic compounds contributing to the antioxidant activity of Maclura pomifera, Ficus carica and Ficus elastica extracts. Anal Lett. 42: 2986-3003, 2009.
[CrossRef]
Vacek J, Petrek J, Kizek R, Havel L, Klejdus B, Trnkova L, Jelen F. Electrochemical determination of lead and glutathione in a plant cell culture. Bioelectrochemistry. 63: 347-351, 2004.
[CrossRef]
[PubMed]
|
BACK
|


